One of my core beliefs about podcasting is that everyone benefits from more transparency about numbers.
So today, I want to share some behind-the-scenes numbers from my new show and a few observations so far.
💡 There are a number of screenshots and graphics in this post that may be able to view/read in your browser here.
For context, here’s the TL;DR on the show:
- The show in question is Podcast Marketing Trends Explained.
- In every episode Justin Jackson from Transistor.fm and I break down one piece of data from the Podcast Marketing Trends 2023 Report and explain what it means—and what it doesn’t mean—for you as a podcast creator to help you market smarter.
- We also offer bonus “Podcast Roast” episodes on Fridays where we review and give feedback on a listener’s show packaging.
- We launched last Tuesday and have released 3 episodes + a teaser so far.
A couple of high-level achievements so far:
- Reached the Top 200 in Apple Podcast Marketing charts in 27 countries, including #32 🇺🇸, #14 🇨🇦, #15 🇬🇧, and #2 🇺🇿 & 🇵🇪 (Uzbekistan & Peru).
- 25 Reviews in Apple Podcasts so far
- 1,693 total downloads
- Lots of shares and kind words from people in the podcast industry I respect and admire
All in all, for a niche show like this, I’m very excited about the launch and the reception it’s received from both indie and industry podcasters as well as others in the podcast industry.
But let’s take a closer look at some of the specific data and some of my (very) early takeaways and observations.
Daily Download Data
We launched the show on February 13th and released additional episodes on Feb 16th and 20th as indicated on the chart below.
The big boost on Feb 20 was the result of 4 factors:
- New episode released
- I promoted the episode in the Scrappy Podcasting Newsletter
- Justin promoted the show in the Transistor.fm newsletter
- James Cridland featured the show in Podnews… which happened because I had submitted a press release to Podnews the previous week.
If you’re curious in digging deeper into our download data, we’ve added the Open Podcast Prefix to our feed which means all of our download data is public.
👉 View our full download data
Alright, let’s keep zooming in.
Device Retention
In our most recent episode, Justin and I talked a lot about the huge issue of listener churn when it comes to growth.
I also recently wrote about it in depth here.
In short, most people think the biggest challenge in podcast marketing is getting more new people to listen.
In my experience, however, the bigger, more immediate, and more long-term valuable opportunity is to get more listeners to keep coming back.
My Chartable device retention numbers illustrate this.
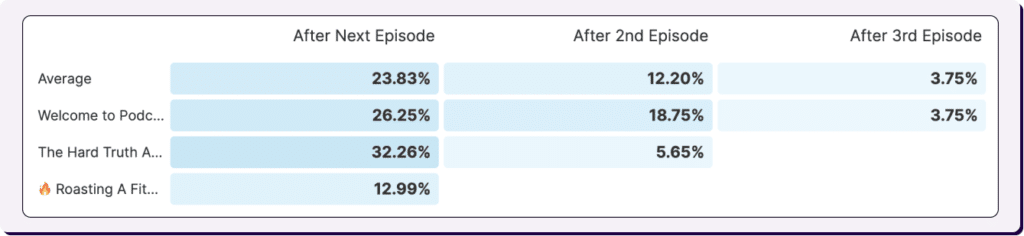
On average, less than 20% of people who listened to one episode of our show came back and listened to a second.
And less than 10% of new listeners listened to a third.
Granted, these numbers are based on a very short timeframe, meaning they will (hopefully) improve.
But these numbers are in line with what I’ve seen from many other shows, which means they may not.
Time will tell.
My Key Metric: Engagement Time
While downloads are nice to have, the metrics I care most about for this (and any show are:
- Total engagement time — How much time was spent listening/watching
- Engagement time/person — On average, how much time did each unique person spend with the show/episode
I measure both of these metrics at both the show and episode level, which you can see in the following graph.
The reason for tracking these metrics is this:
Like most people who read this newsletter, my content is part of my business.
And the more time someone spends with me and my content, the more likely they are to one day consider:
- Signing up to work with me
- Buying one of my products
- Sharing my work with a friend
- Any of the other positive outcomes that drives the growth of the business
What’s more, the more time that is spent with my content, the more valuable my content becomes to potential advertisers and brand partners.
In short, downloads are simply a convenient (but inaccurate) shorthand for the metric that really matters: Time your audience spends with you.
Here’s how I track it across the various platforms.
One of the things that I’m most interested in exploring with both this show and others I’ll be launching this year is the differences in engagement between YouTube and traditional podcast platforms.
So far, a couple of things have stood out to me:
- I’ve been surprised at how significant a percentage of people are watching the show on YouTube. In fact, YouTube easily accounts for more views/plays than Apple and Spotify combined and 21% of total engagements. But…
- The total engagement time on YouTube is drastically lower than on audio-only platforms, accounting for only 12% of the total engagement time.
We can see the difference in retention on these charts:
None of this is particularly surprising, but to me, it reinforces the value and the promise of audio-only content in a time when an increasing emphasis is being put on video.
On a related note, it’s been interesting to use Chartable SmartLinks to be able to track that a decent percentage (6%) of people who initially clicked through to watch the show on YouTube ended up listening in a podcast app as well.
What Else Do You Want to See?
One of the things I’m most excited about with this show is continuing to share the behind-the-scenes details of my creation and marketing process.
If there’s anything that you’d love particular insight into, hit reply and let me know what would be most useful to you.
If you enjoyed this data-driven approach to podcast marketing and haven’t already listened to the show, you can listen in your favourite app here or watch on YouTube here.
And if you’re interested in building out a more robust, data-backed marketing strategy for your show, I’ll be overhauling the data and analytics module in Podcast Marketing Academy in the near future and adding a bunch of new tracking templates, approaches to podcast data analysis, and more.
I’d love to have you.