Podcast Marketing Trends 2023 Report

Presented By


It’s easier than ever to launch and produce a podcast.
But it’s never been harder to grow one.
This report is designed to play a small but important role in changing that.
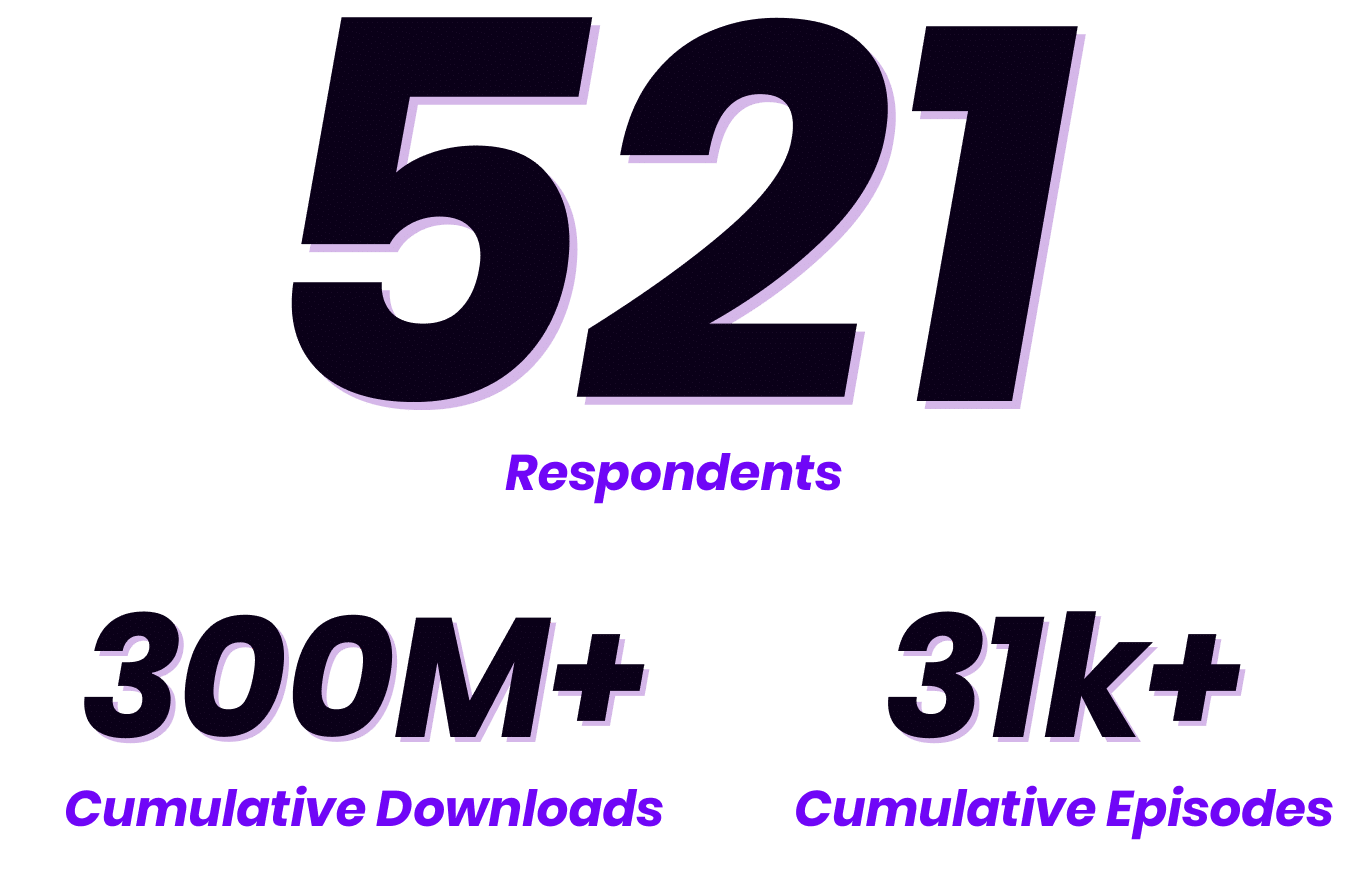
What are the factors that contribute to podcast growth?
This is the guiding question behind this report.
To attempt to answer it, we enlisted the help of 521 podcasters and industry professionals from a diverse set of personal backgrounds, niches, formats, and experience.
In Q1 of 2023, we asked them to complete a sadistically long and detailed survey, sharing month-by-month episode data, marketing activities, and a whole lot more.
To our delight (and to be honest, a bit of surprise), many were more than happy to do so.
Big vs Small
One of the questions we were most excited to explore was the difference between the actions, strategies, resources, and attributes of big shows vs those of smaller shows.
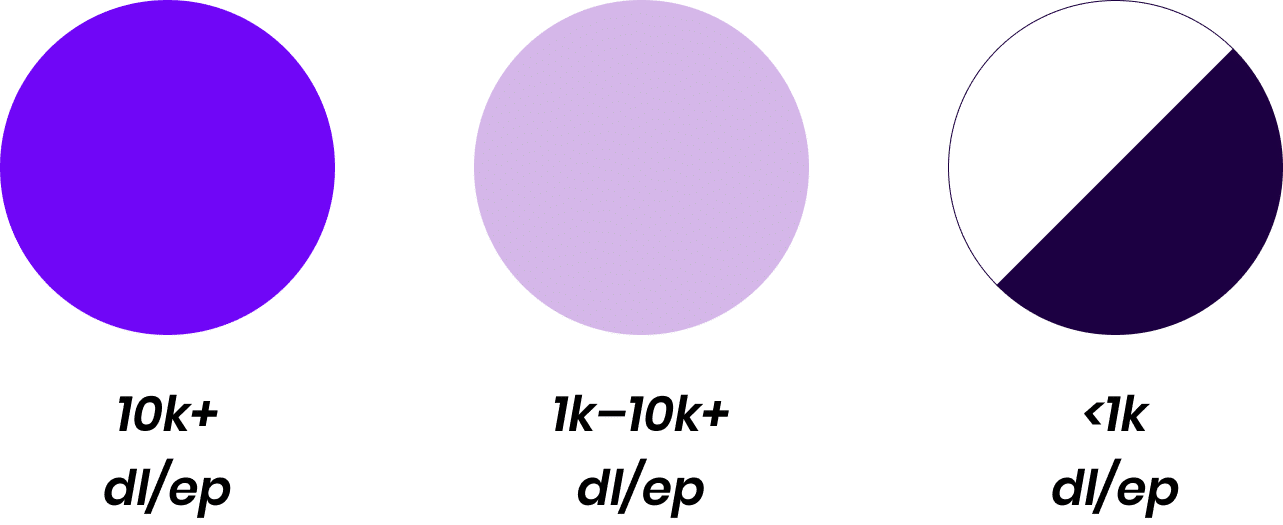
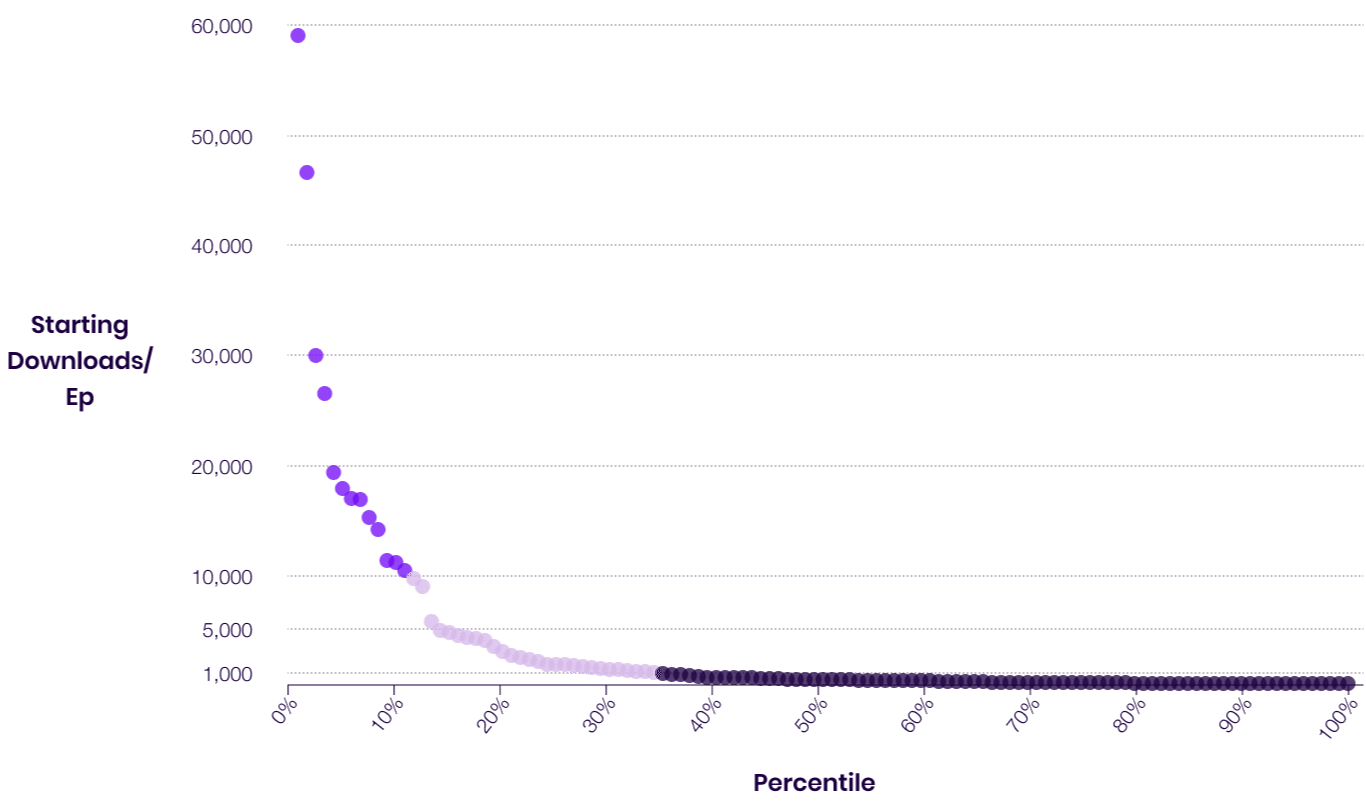
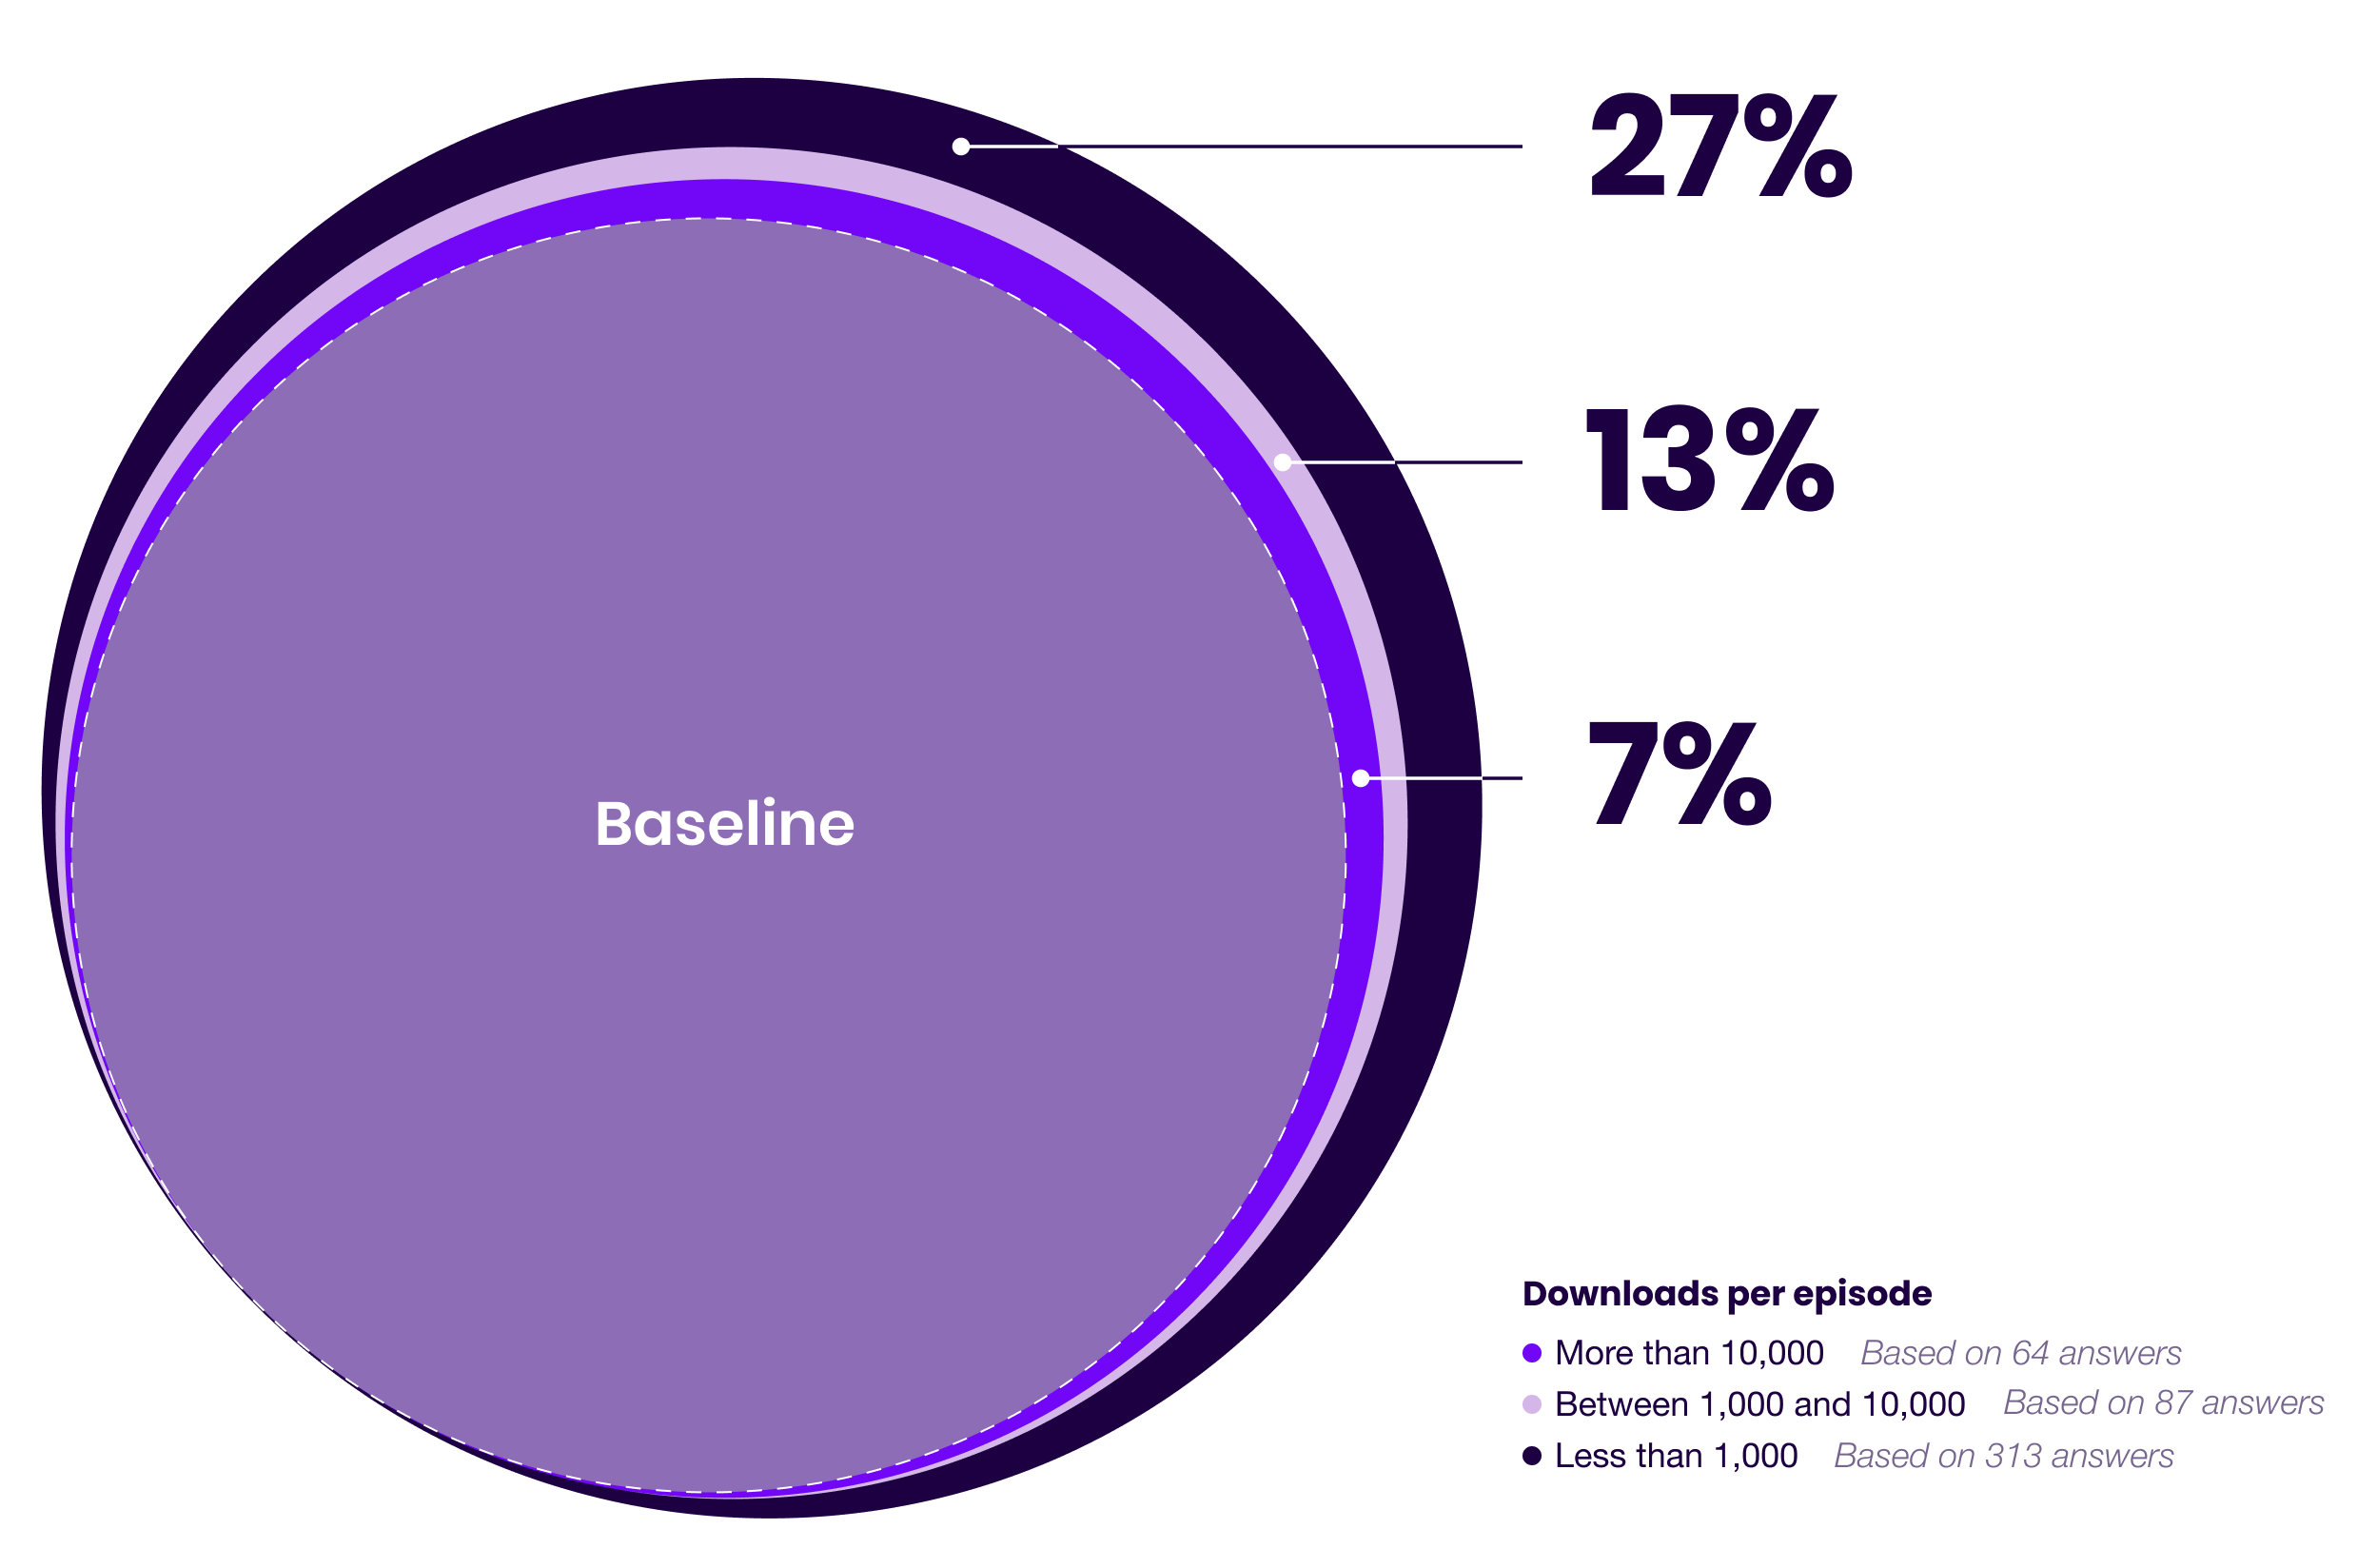
To do this, we divided the responses into three segments based on their self-reported download data and cross-analyze various other data points.
Throughout the report, we’ve represented these 3 distinct groups as follows.

10k+
dl/ep

1k–10k
dl/ep

<1k
dl/ep
Downloads Per Episode Distribution
Methodology
We calculated downloads per episode by dividing the total monthly reported downloads by the number of new episodes released that month.
While this approach does not account for the impact of back-catalogue downloads, we preferred this approach over segmenting based on overall monthly downloads as it better accounts for changes in publishing schedules.
01
About the Respondents
Our respondents offer a nuanced perspective on podcast creation and growth.
Together, they represent 6 continents (sorry Antarctica) and a diversity of languages, show formats, topic categories, reasons for creating, and more.
Here’s a little bit about who they are.
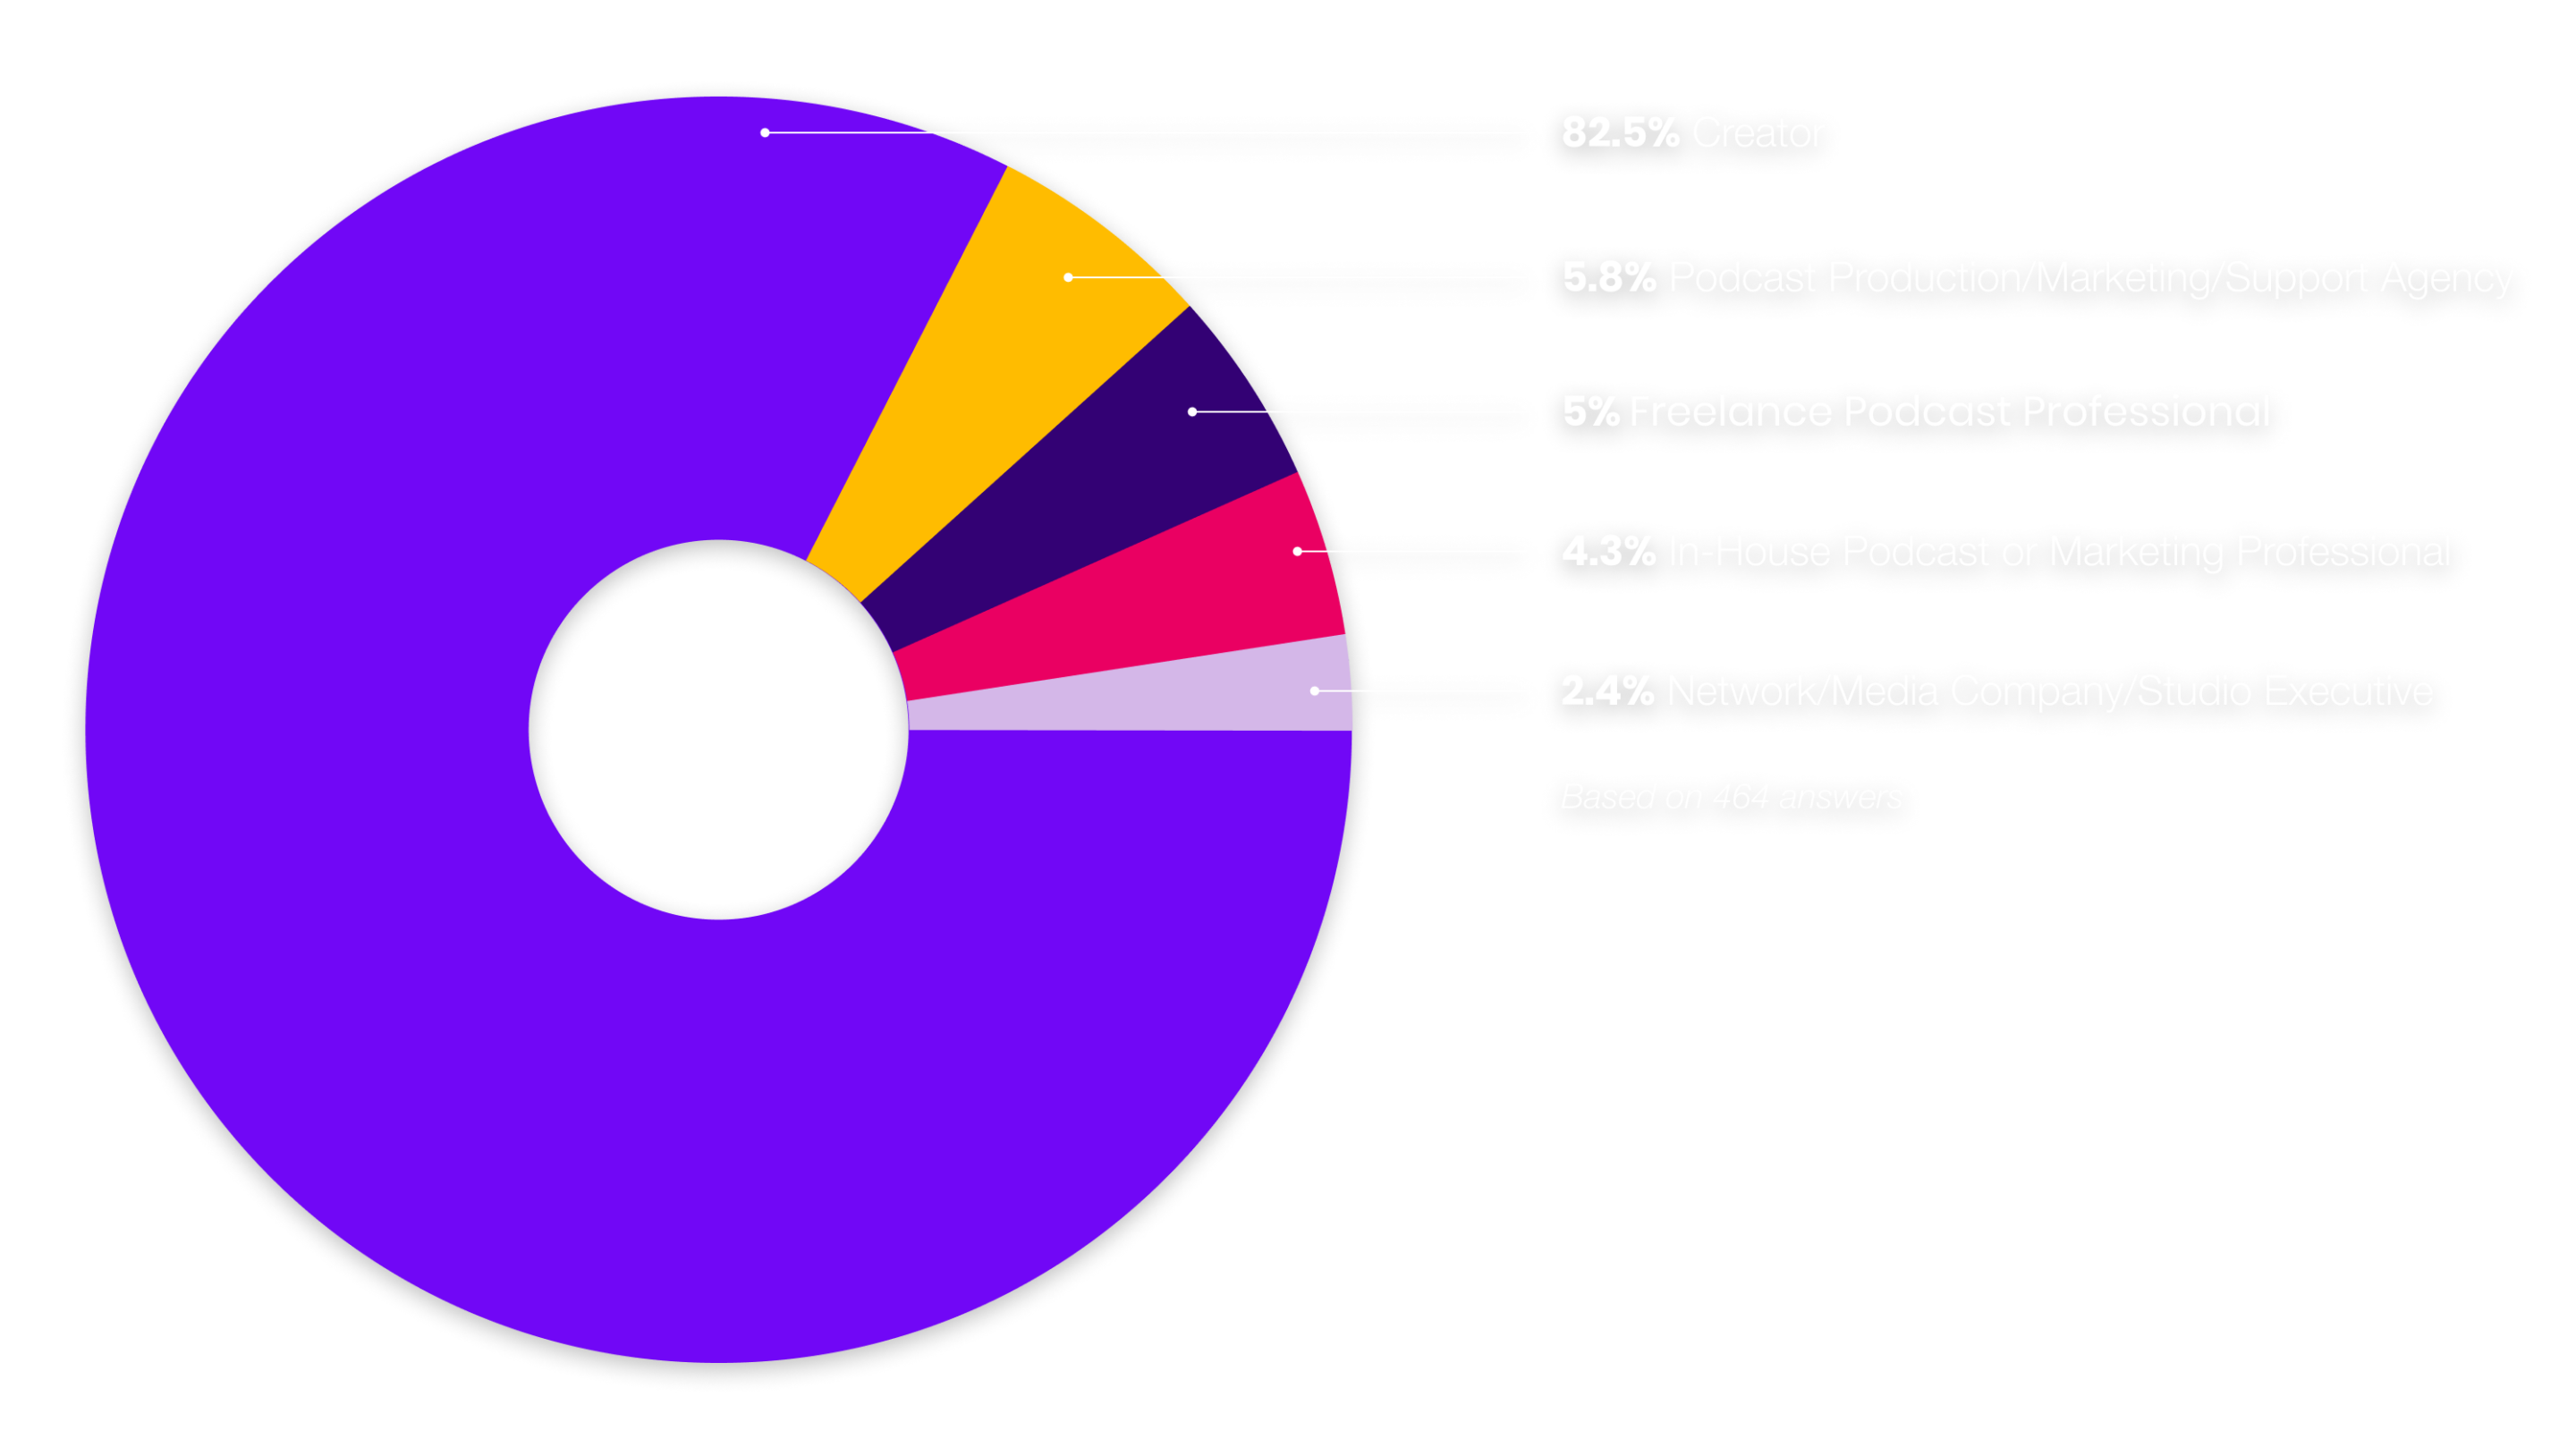
Role In the Podcast Industry
Show Purpose

Business Model
Respondents for whom generating an income is at least part of the reason they produce their shows, these are the business models they’re pursuing.

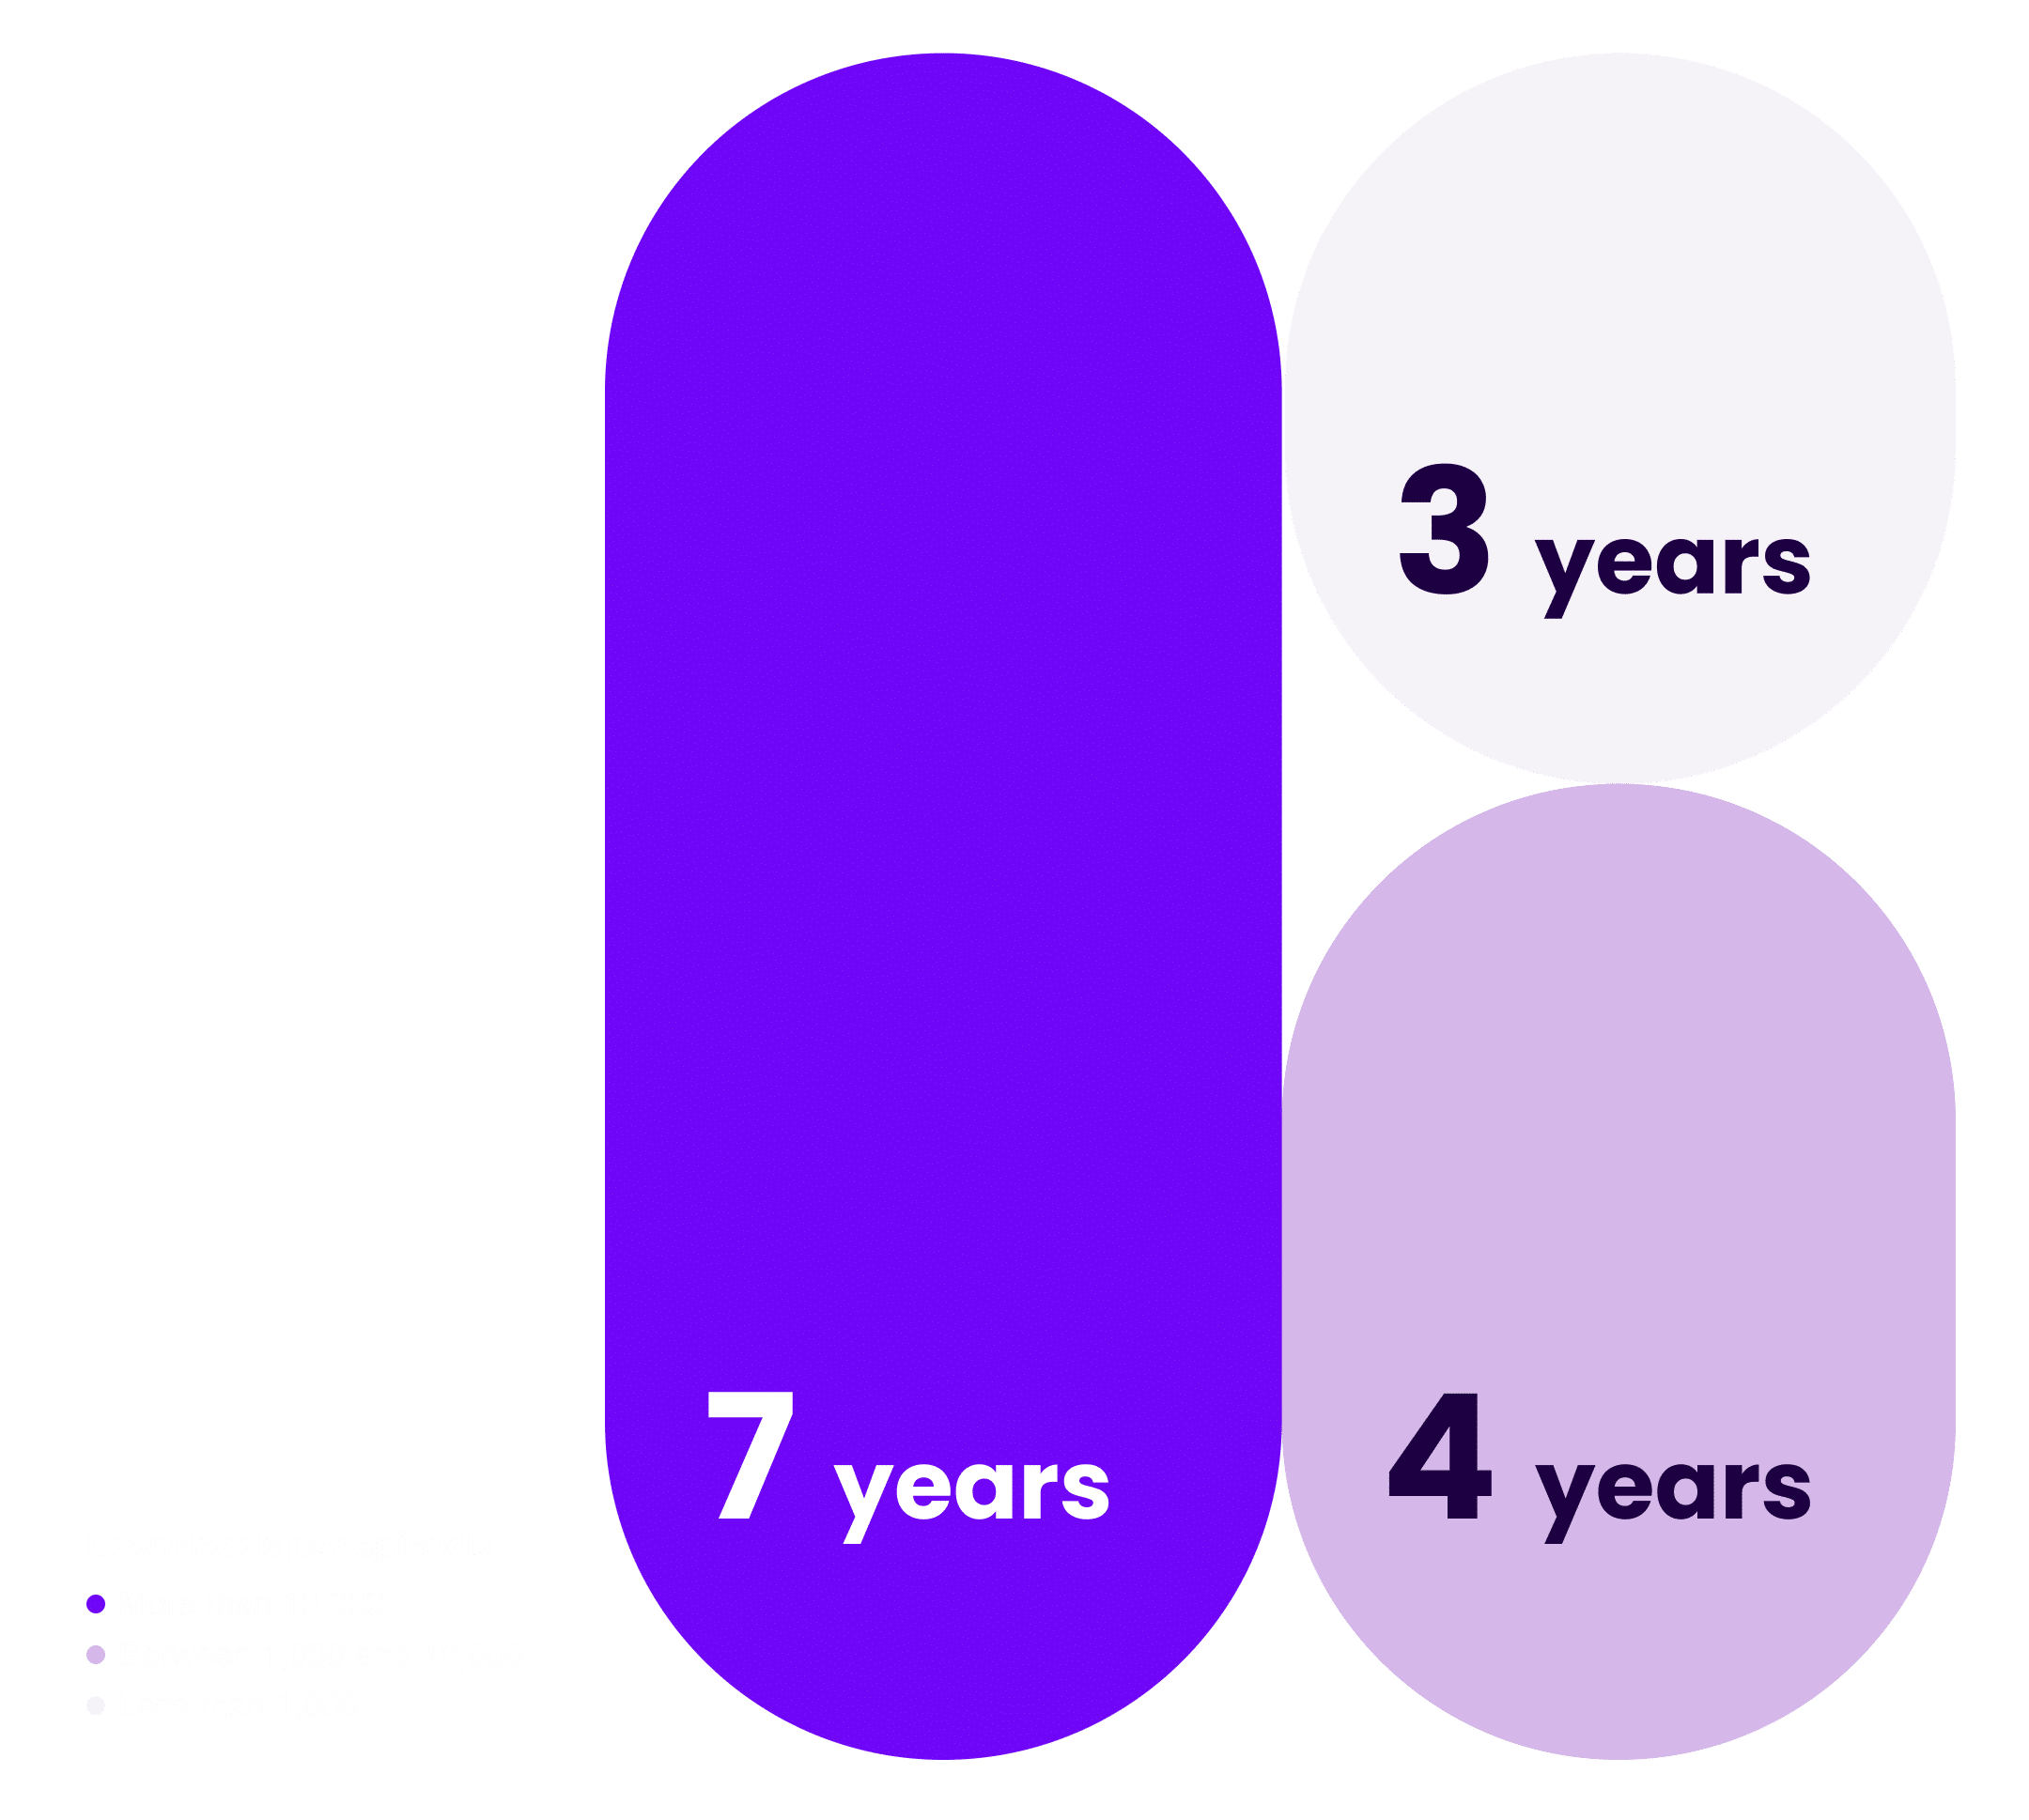
Podcasting Experience
4.3
Average years of experience
Marketing Proficiency

We asked respondents to rate themselves on a scale of 1–10 when it came to how proficient they are at marketing, with 10 being highly proficient, and 0 being… less than proficient.
02
Benchmarks
Unlike many other content creation and marketing mediums, most podcasting data isn’t publicly accessible (though the Open Podcast Prefix Project is working to change that).
While there are certainly benefits to this lack of transparency, it also makes it hard to know where exactly your show stands in regards to others and which shows are worth studying to take inspiration from for your own marketing.
To help provide clarity, we’ve assembled a series of podcasting marketing benchmarks we’ve been waiting years to have ourselves.
Note: All download-related data is based on the responses from shows that had been actively publishing for at least one year and included a full 12-months of download data.
Annual Trends
Downloads Per Episode By Month
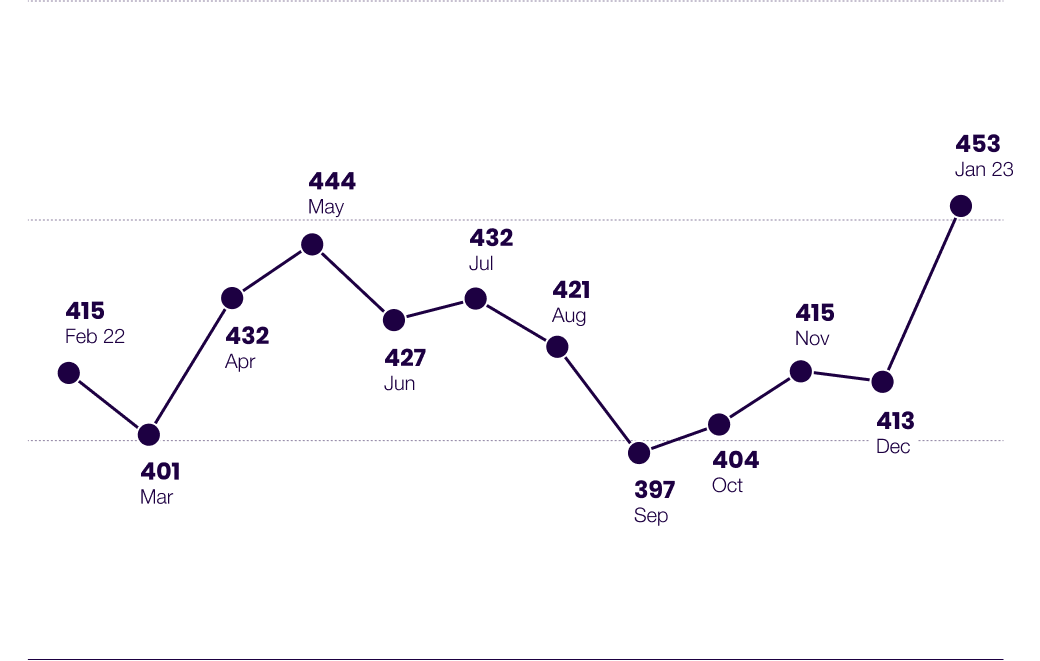
The Median Show Gets
421
Downloads/Episode
1,425
Downloads/Month
The Median Show Gets
421
Downloads/Episode
1,425
Downloads/Month
Downloads Per Episode By Month

Episodes Published/Month
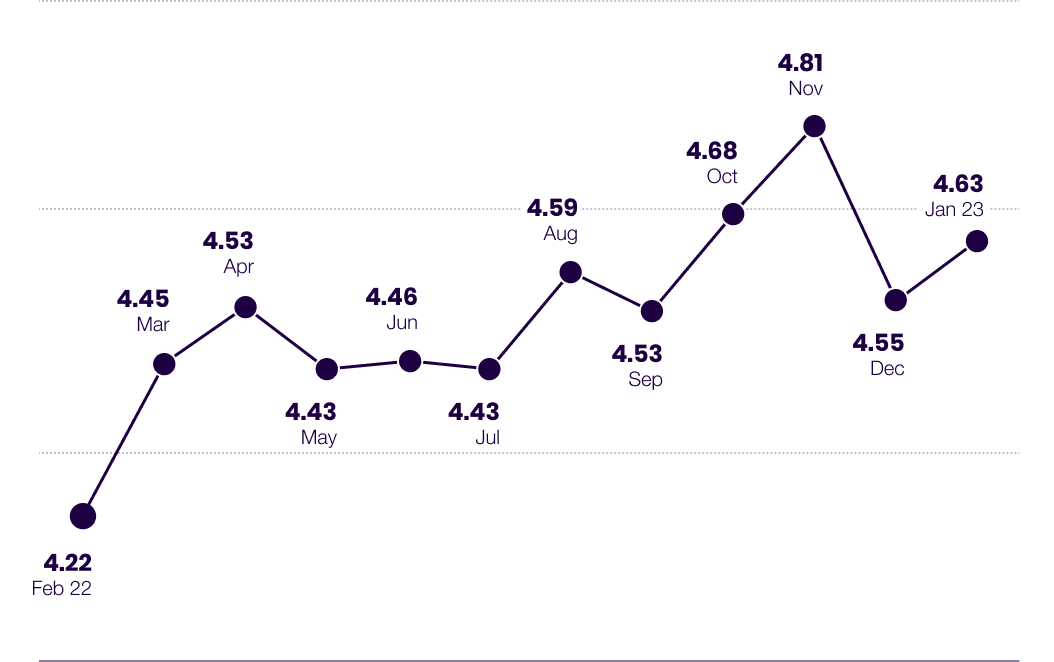

Episodes Published Per Month
Key Takeaway
Definitely some interesting surprises to be found in the annual trends.
For one, it was interesting to see that November, a month where many are taking time off for the holidays was the month with the highest number of episodes published.
Also interesting is the download dip in September and October which goes against the common notion that summer is the slow season for podcasts with things picking up in the fall.
Our suspicion would be that people have so much going on in September with back-to-school and returning from the holidays that podcasts get pushed down the priority list.
Finally, the upward annual trend of episodes-per-month published aligns with our respondents’ self-reporting, with the average respondent saying they published more episodes this year than in the previous year.
Podcast Growth Rate Benchmarks
How quickly does the typical show grow?
Of all the questions we had going in, this was the biggest.
A benchmark growth rate allows you to calculate how many new listeners you can expect to bring in each month, which allows you to assessess the effectiveness of your marketing, make better-informed growth & revenue projections, and a whole lot more.
Here’s what we found.
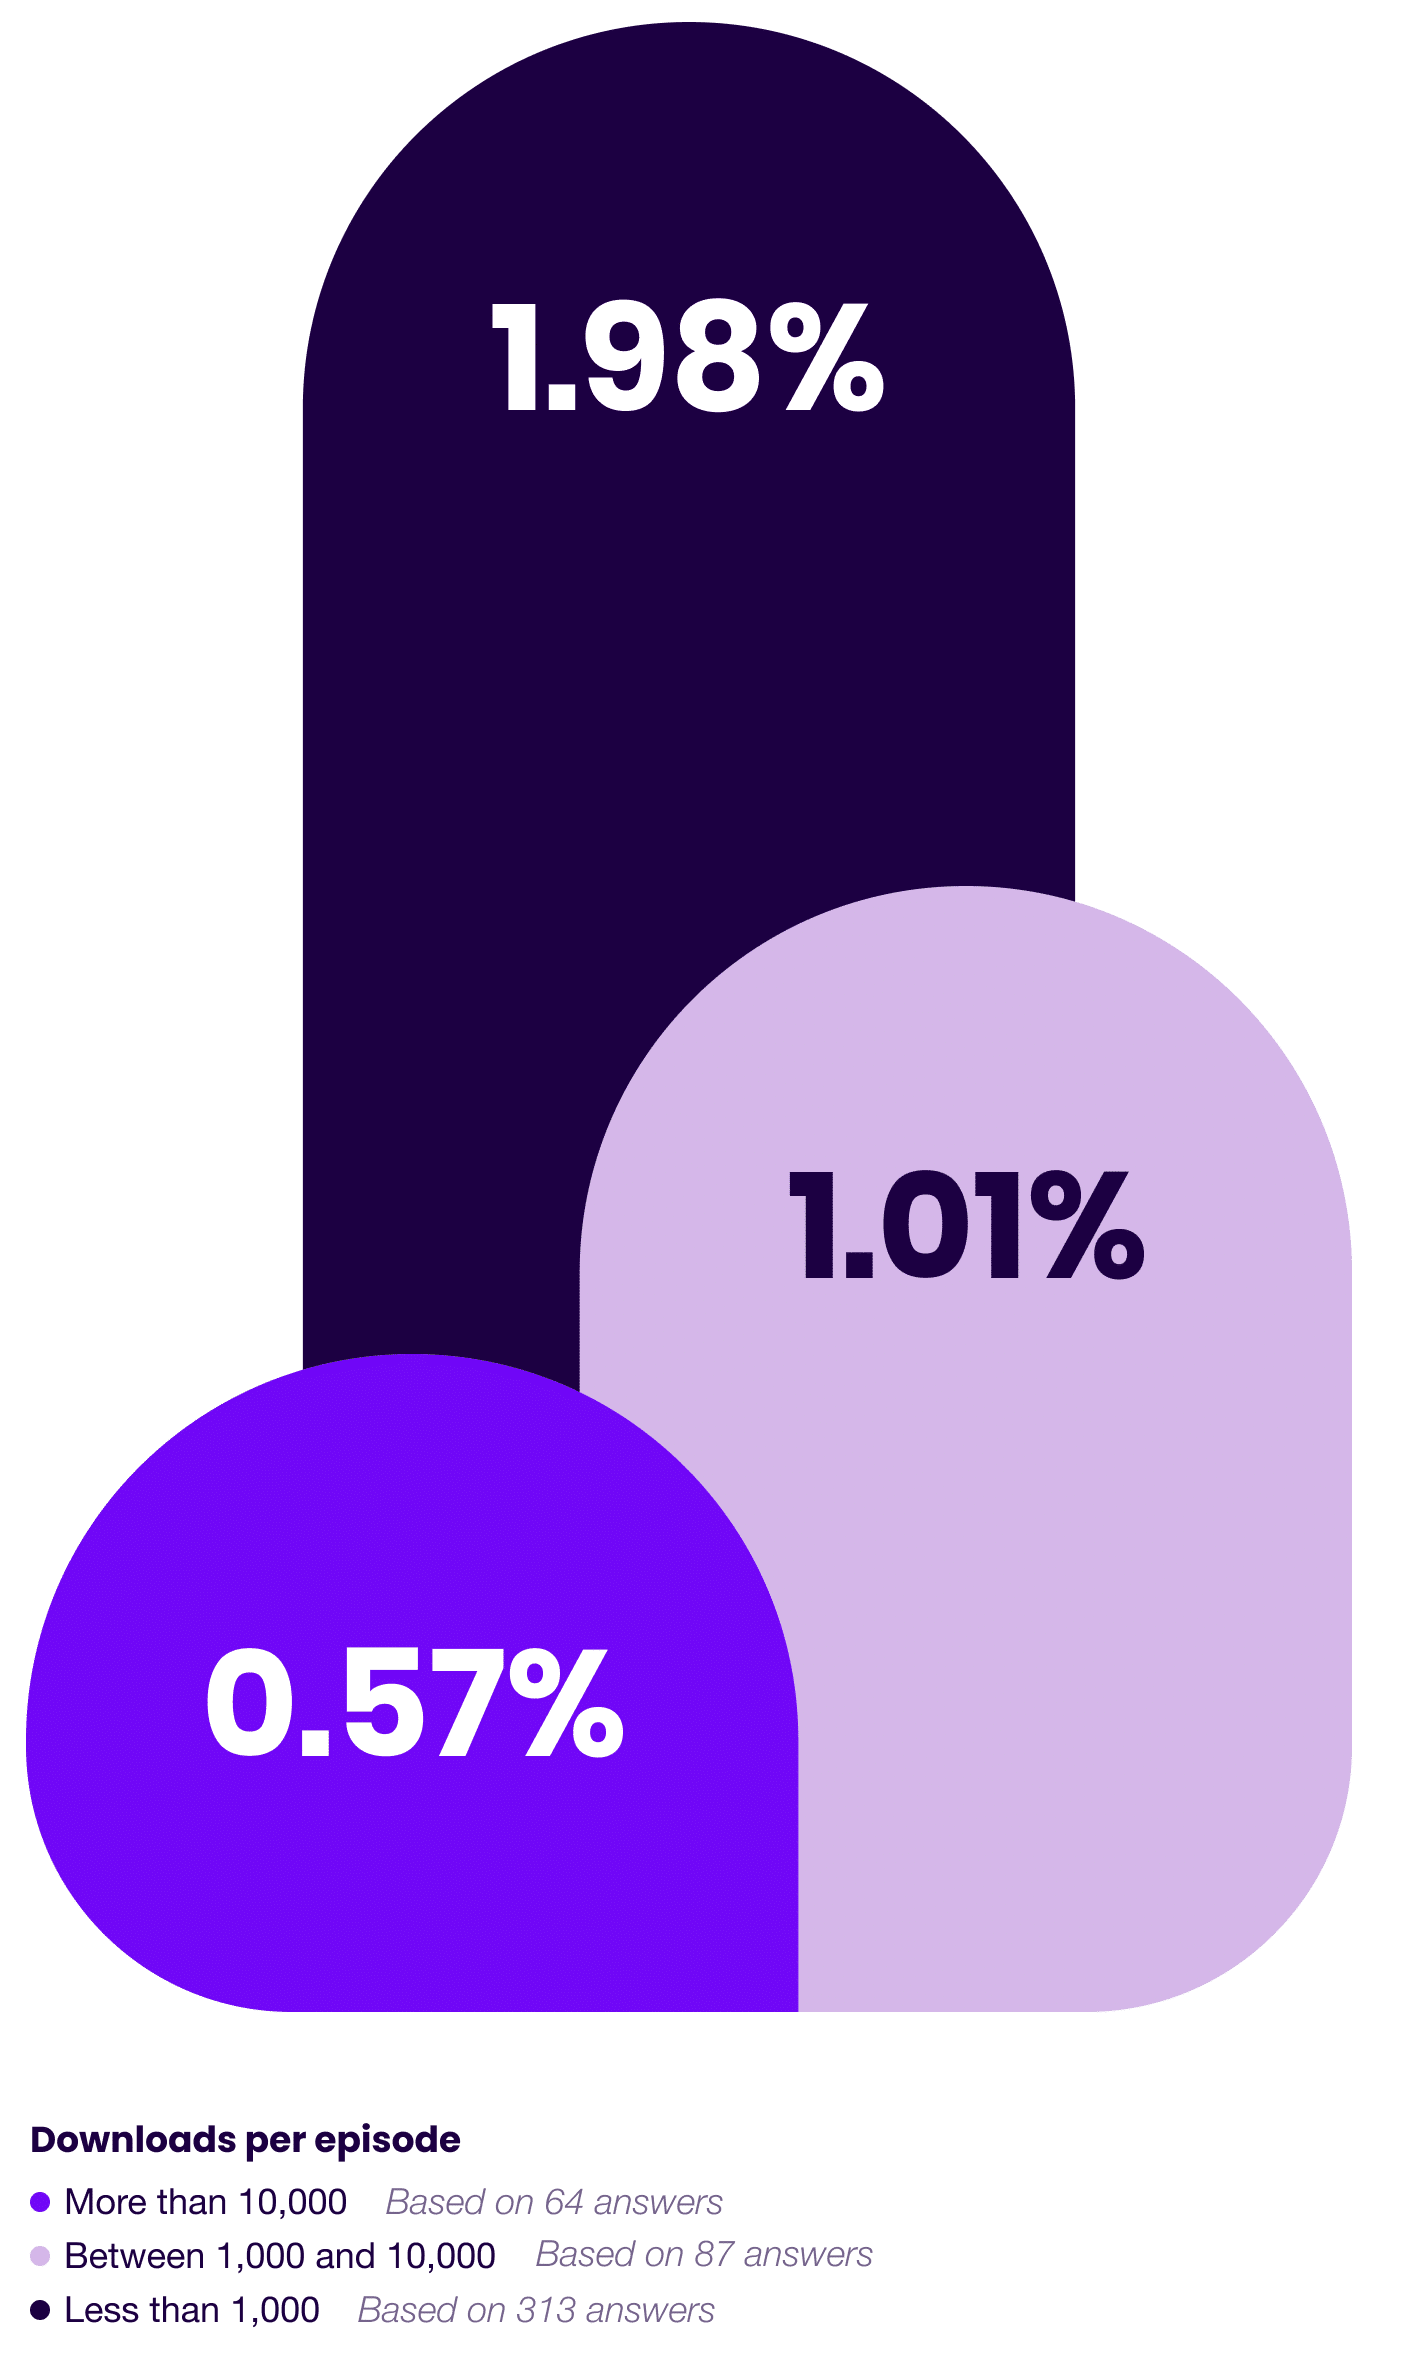
Month-Over-Month Podcast Growth Rate
1.62%
Median MOM Growth Rate
Context
Based on these benchmarks, here’s how many downloads a typical show in each size range could expect to grow by each month:
500 dl/mo = +10 new dl/mo
5,000 dl/mo = +50 new dl/mo
50,000 dl/mo = +285 new dl/mo
Month-Over-Month Podcast Growth Rate
1.62%
Median MOM Growth Rate

Context
Based on these benchmarks, here’s how many downloads a typical show in each size range could expect to grow by each month:
500 dl/mo = +10 new dl/mo
5,000 dl/mo = +50 new dl/mo
50,000 dl/mo = +285 new dl/mo
Annual Growth Rate
21%
Median Annual Growth Rate
Context
Based on these benchmarks, here’s how many downloads a typical show in each size range could expect to grow by from one year to the next:
5,000 dl/yr → 6,350 dl/yr
50,000 dl/mo → 56,500 dl/yr
500,000 dl/mo → 535,000 dl/yr
Annual Growth Rate

21%
Median Annual Growth Rate
Context
Based on these benchmarks, here’s how many downloads a typical show in each size range could expect to grow by from one year to the next:
5,000 dl/yr → 6,350 dl/yr
50,000 dl/mo → 56,500 dl/yr
500,000 dl/mo → 535,000 dl/yr
Key Takeaway
We’ll be honest, these growth rate benchmarks are a little depressing.
There’s a bright side to this data, however, which is this:
If you’ve been frustrated with the growth of your show, it’s not just you.
More than anything, these benchmarks reinforce the idea that many cross-platform creators and marketers have known (or at least suspected) for a while: Podcasting as a whole is a challenging medium to build an audience in.
That’s not to say no one’s figured out how to grow, however…
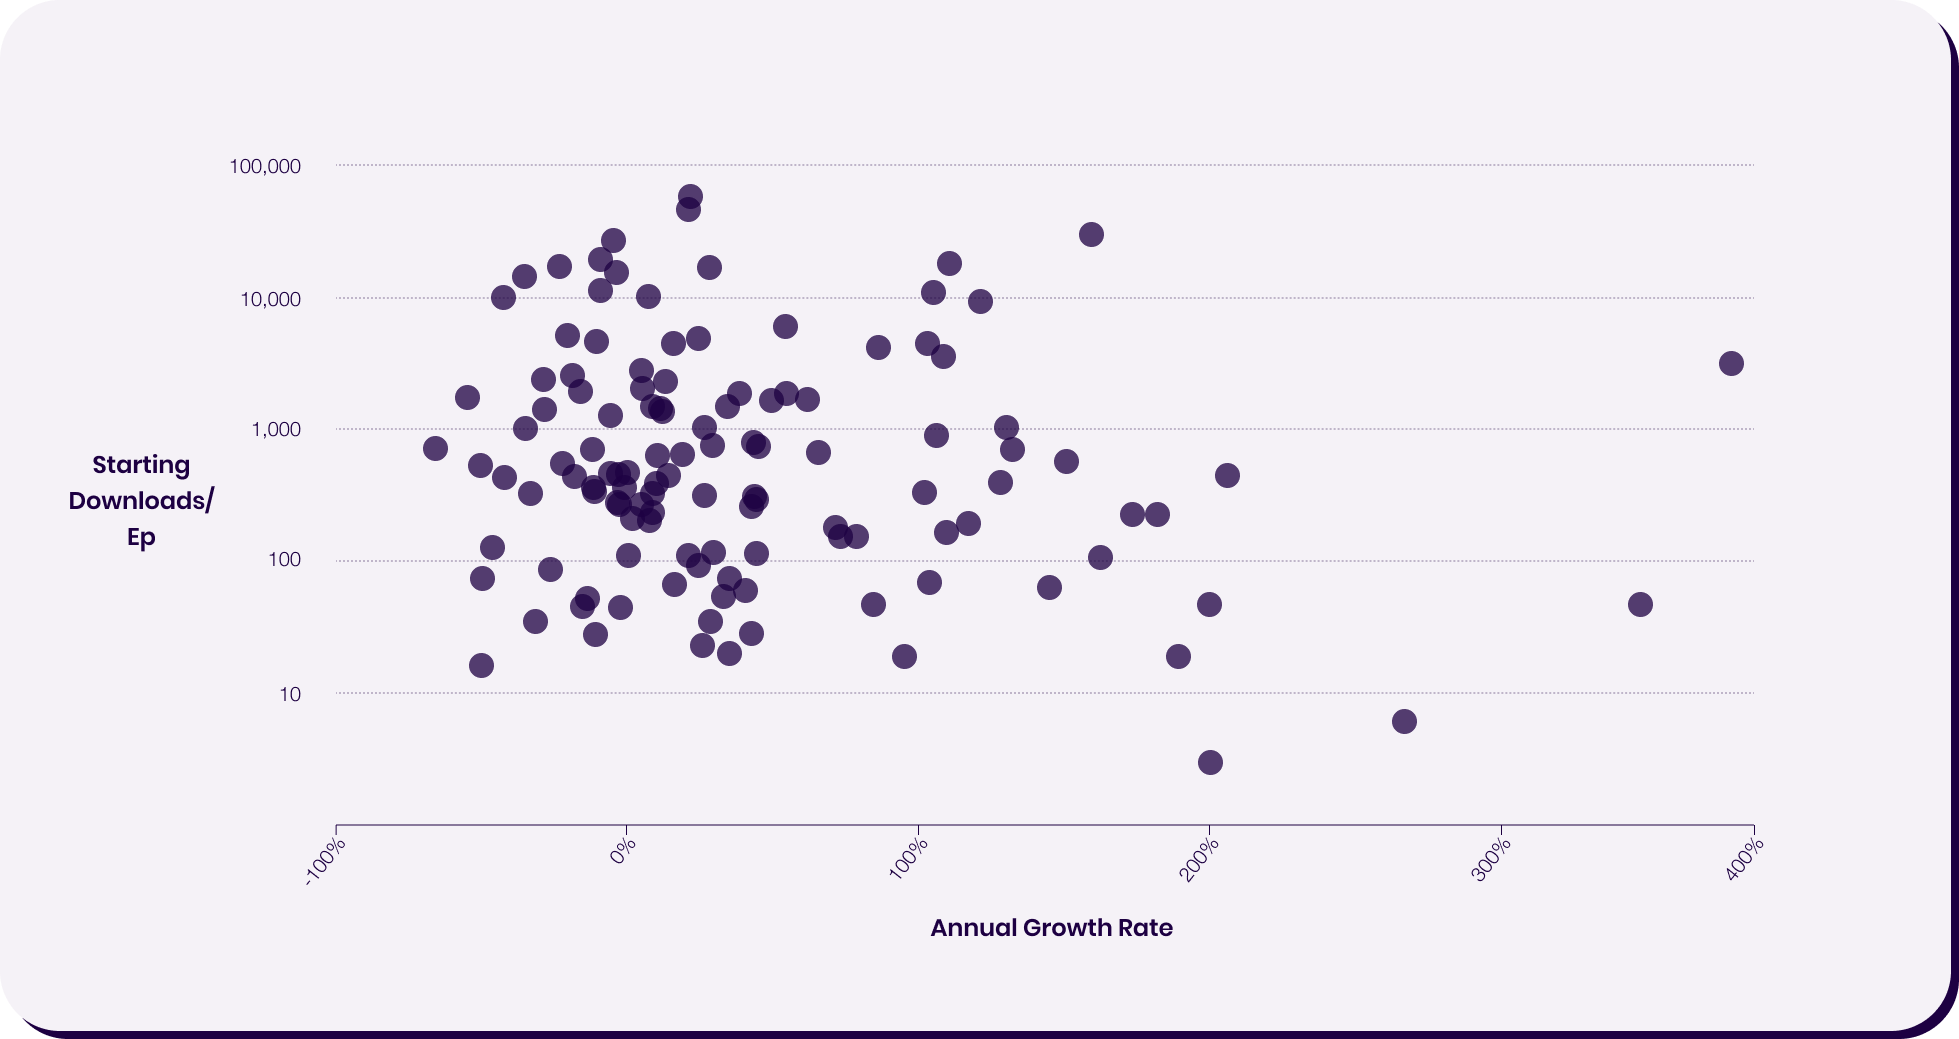
Annual Growth Rate Distribution
While the 21% median annual growth rate from our respondents is lower than most creators and marketers would aspire for, there were a significant number of outliers.
In fact, nearly half of our respondents managed to outperform the median, and one in five respondents doubled their downloads over a one-year span.
Here’s the growth rate distribution based on respondents’ downloads-per-episode data at the start of the reporting period (February 2022).
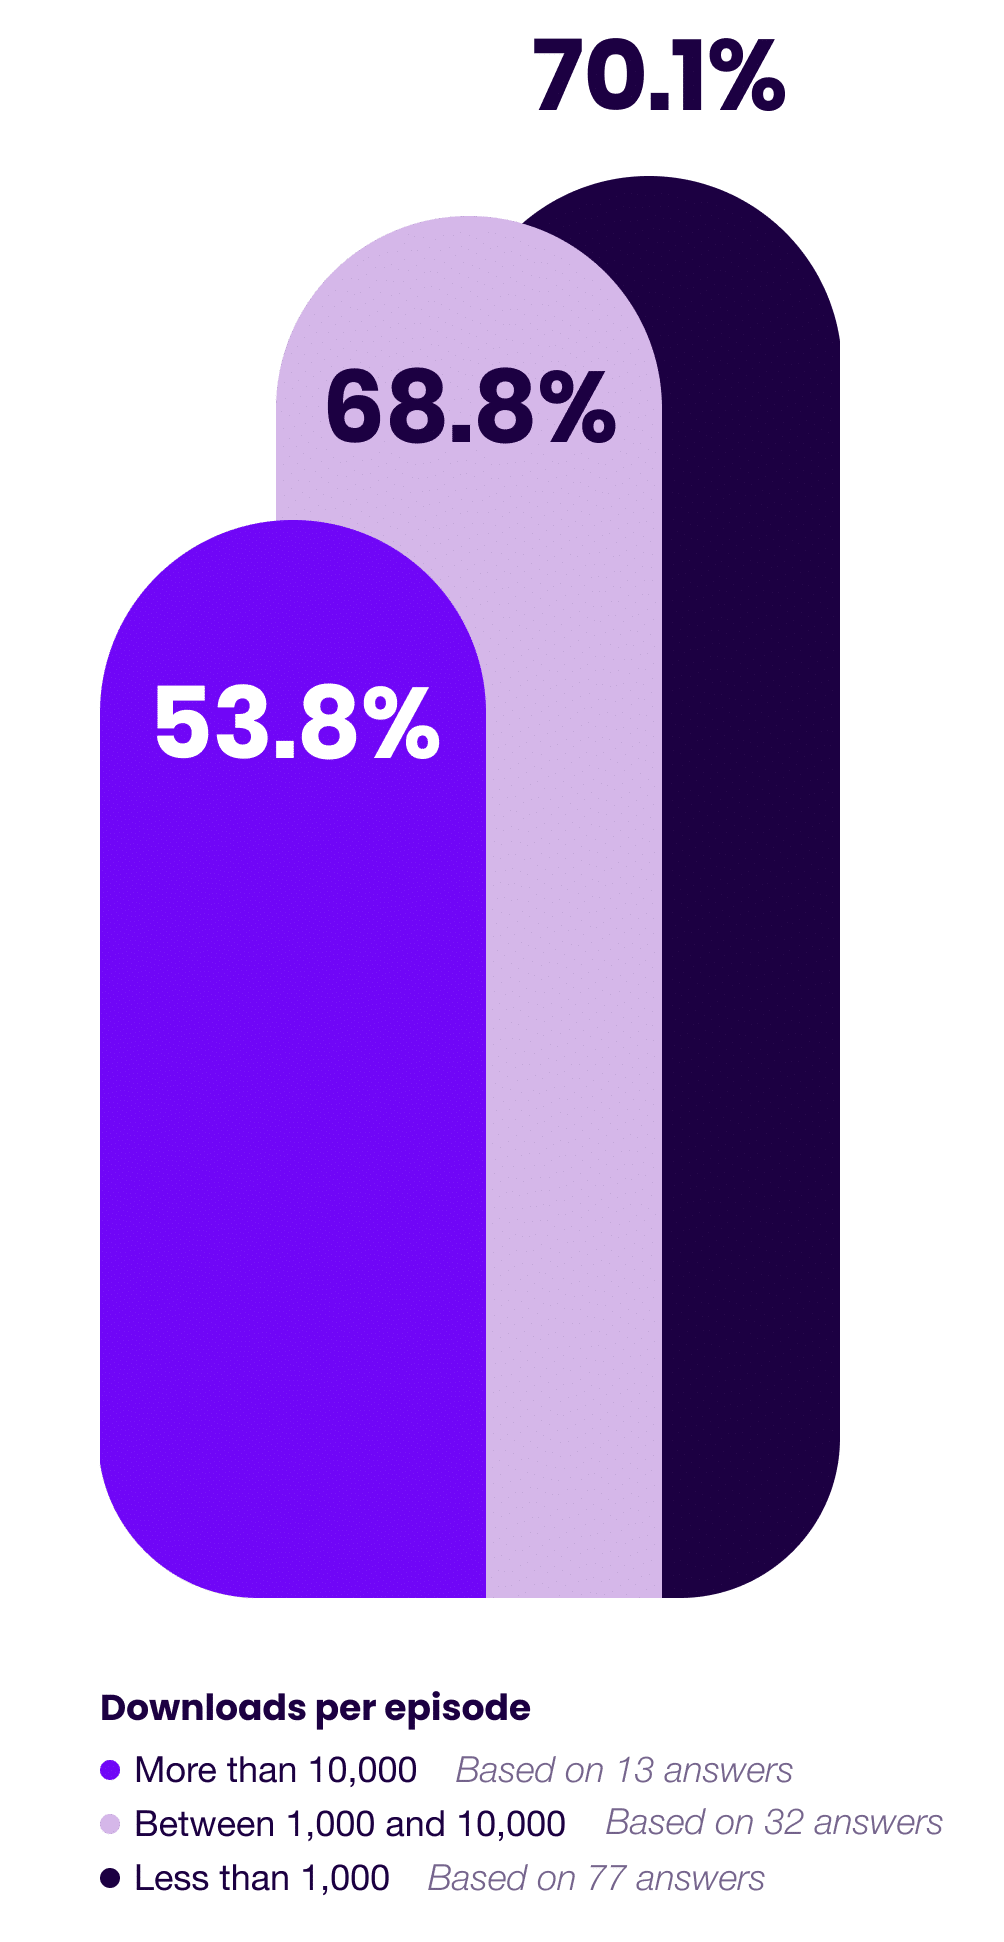
How Likely Is Growth?
Many creators assume that there’s nowhere to go but up after launching a show.
And while that be true when you’re starting from zero, our findings clearly illustrate that for established shows, growth is not a given.
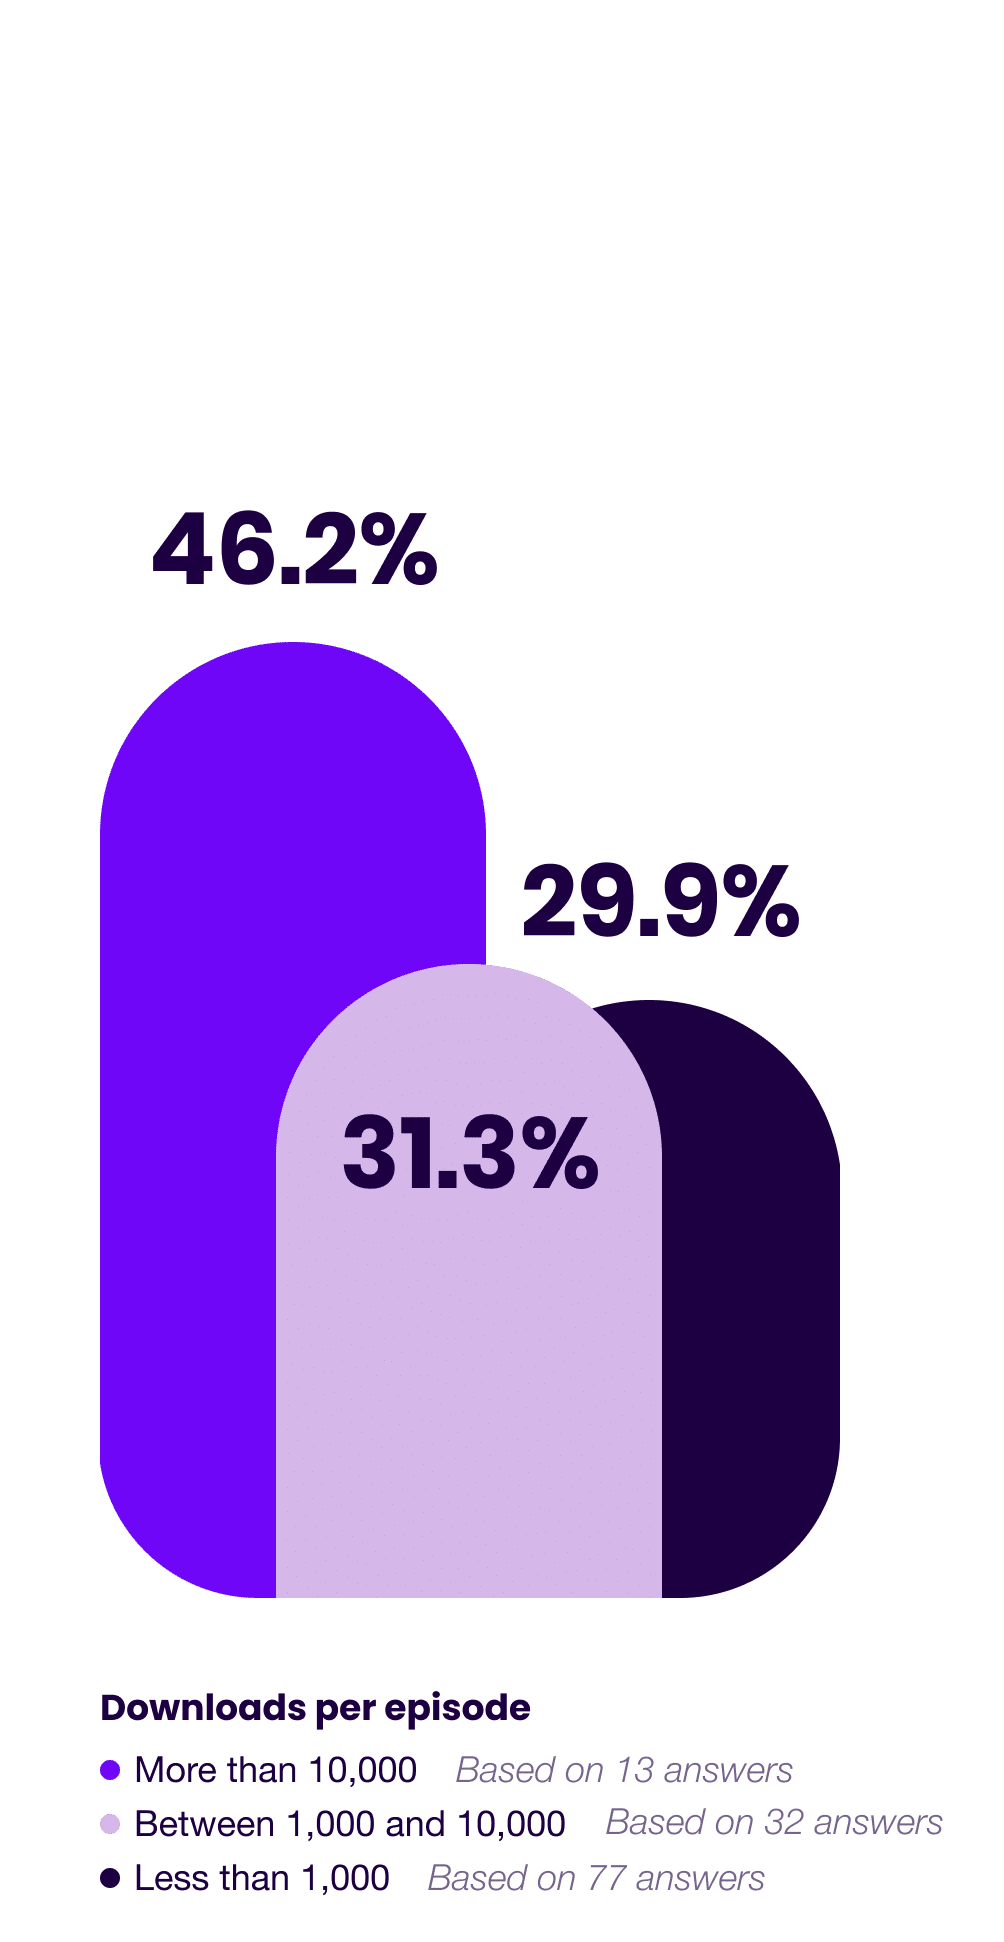
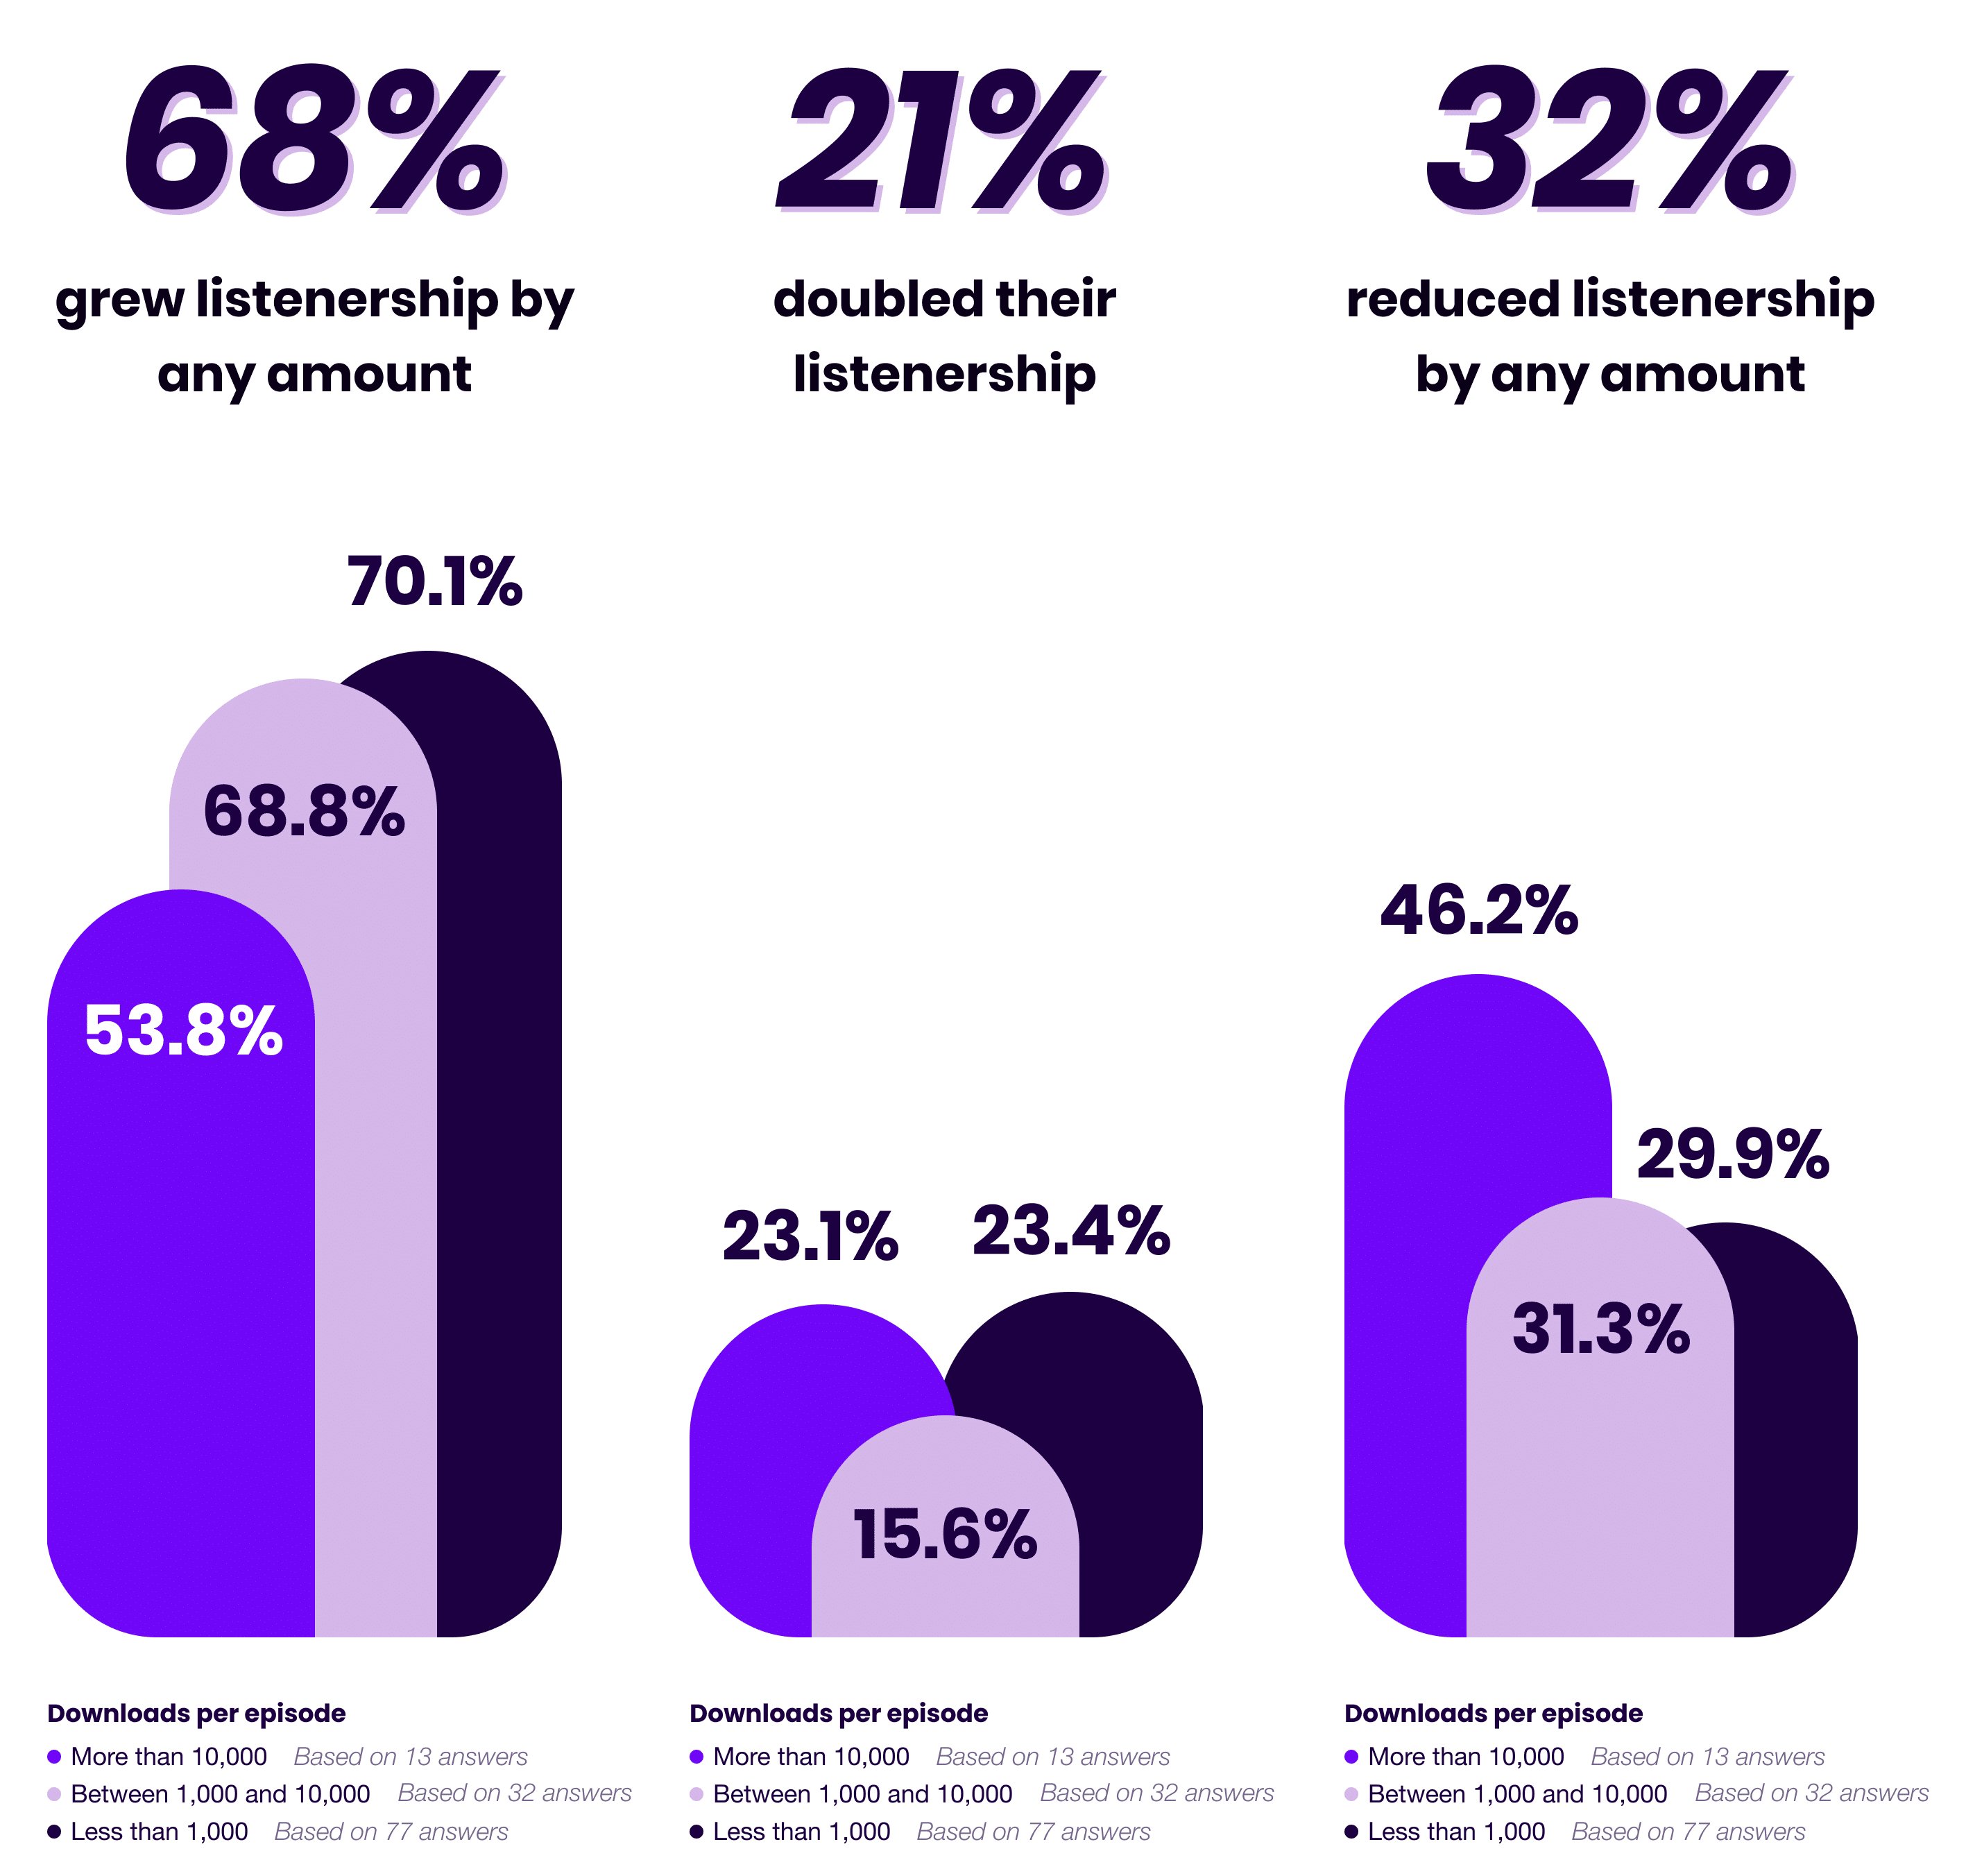
In fact, the larger you grow, the harder it is to keep growing… and the more likely you are to actually lose listeners.
68%
grew listenership by any amount
21%
doubled their listenership
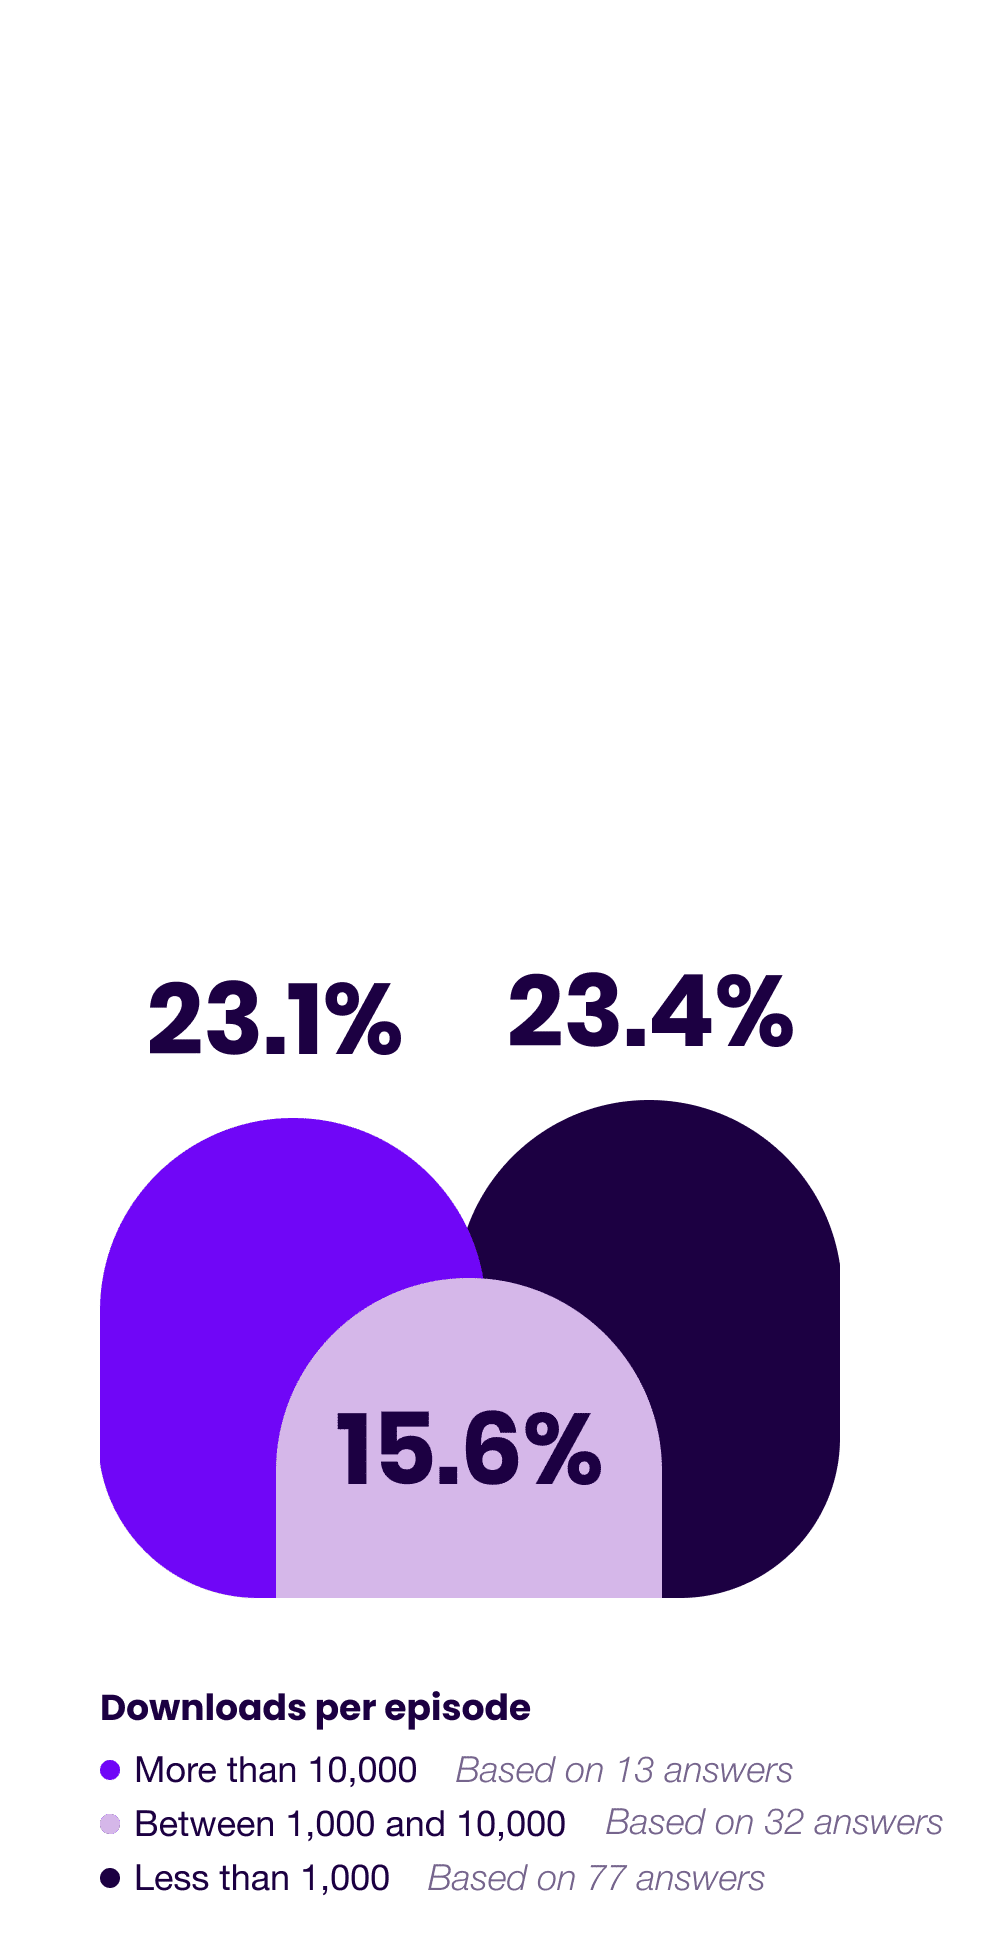
32%
reduced listenership by any amount
Key Takeaways
>10k dl/ep
The bigger they are, the harder they fall.
Or at least, the harder it is to keep finding new listeners interested in your content.
It’s worth noting that while shows with more than 10k dl/ep were more likely to decline in downloads on a per-episode basis, only one of these shows experienced a decline in gross annual downloads.
The reason?
The largest shows were significantly more likely to increase their publish frequency throughout the year.
<1k dl/ep
On the flip side, shows with less that 1k dl/ep were most likely to grow by any amount, as well as double their audience.
This makes logical sense.
It’s much easier for a show with 100 unique listeners to find 100 more than it is for a show with 100,000 unique listeners to find 100,000 more.
1k–10k dl/ep
While the mid-tier shows only slightly trailed the smaller shows in their likelihood of growth, they were least likely to double their listenership.
Our guess as to why?
Mid-tier shows likely don’t have the reach and resources of the big shows, nor the advantage of small starting numbers (that are easier to double) of the small shows.
What’s more, many shows in this category have reached a transition point where what worked to grow them to this stage is no longer working.
In short, they need to adapt their marketing strategies to the new challenge at hand if they want to continue to grow.
Podcast Episode Consumption Benchmarks
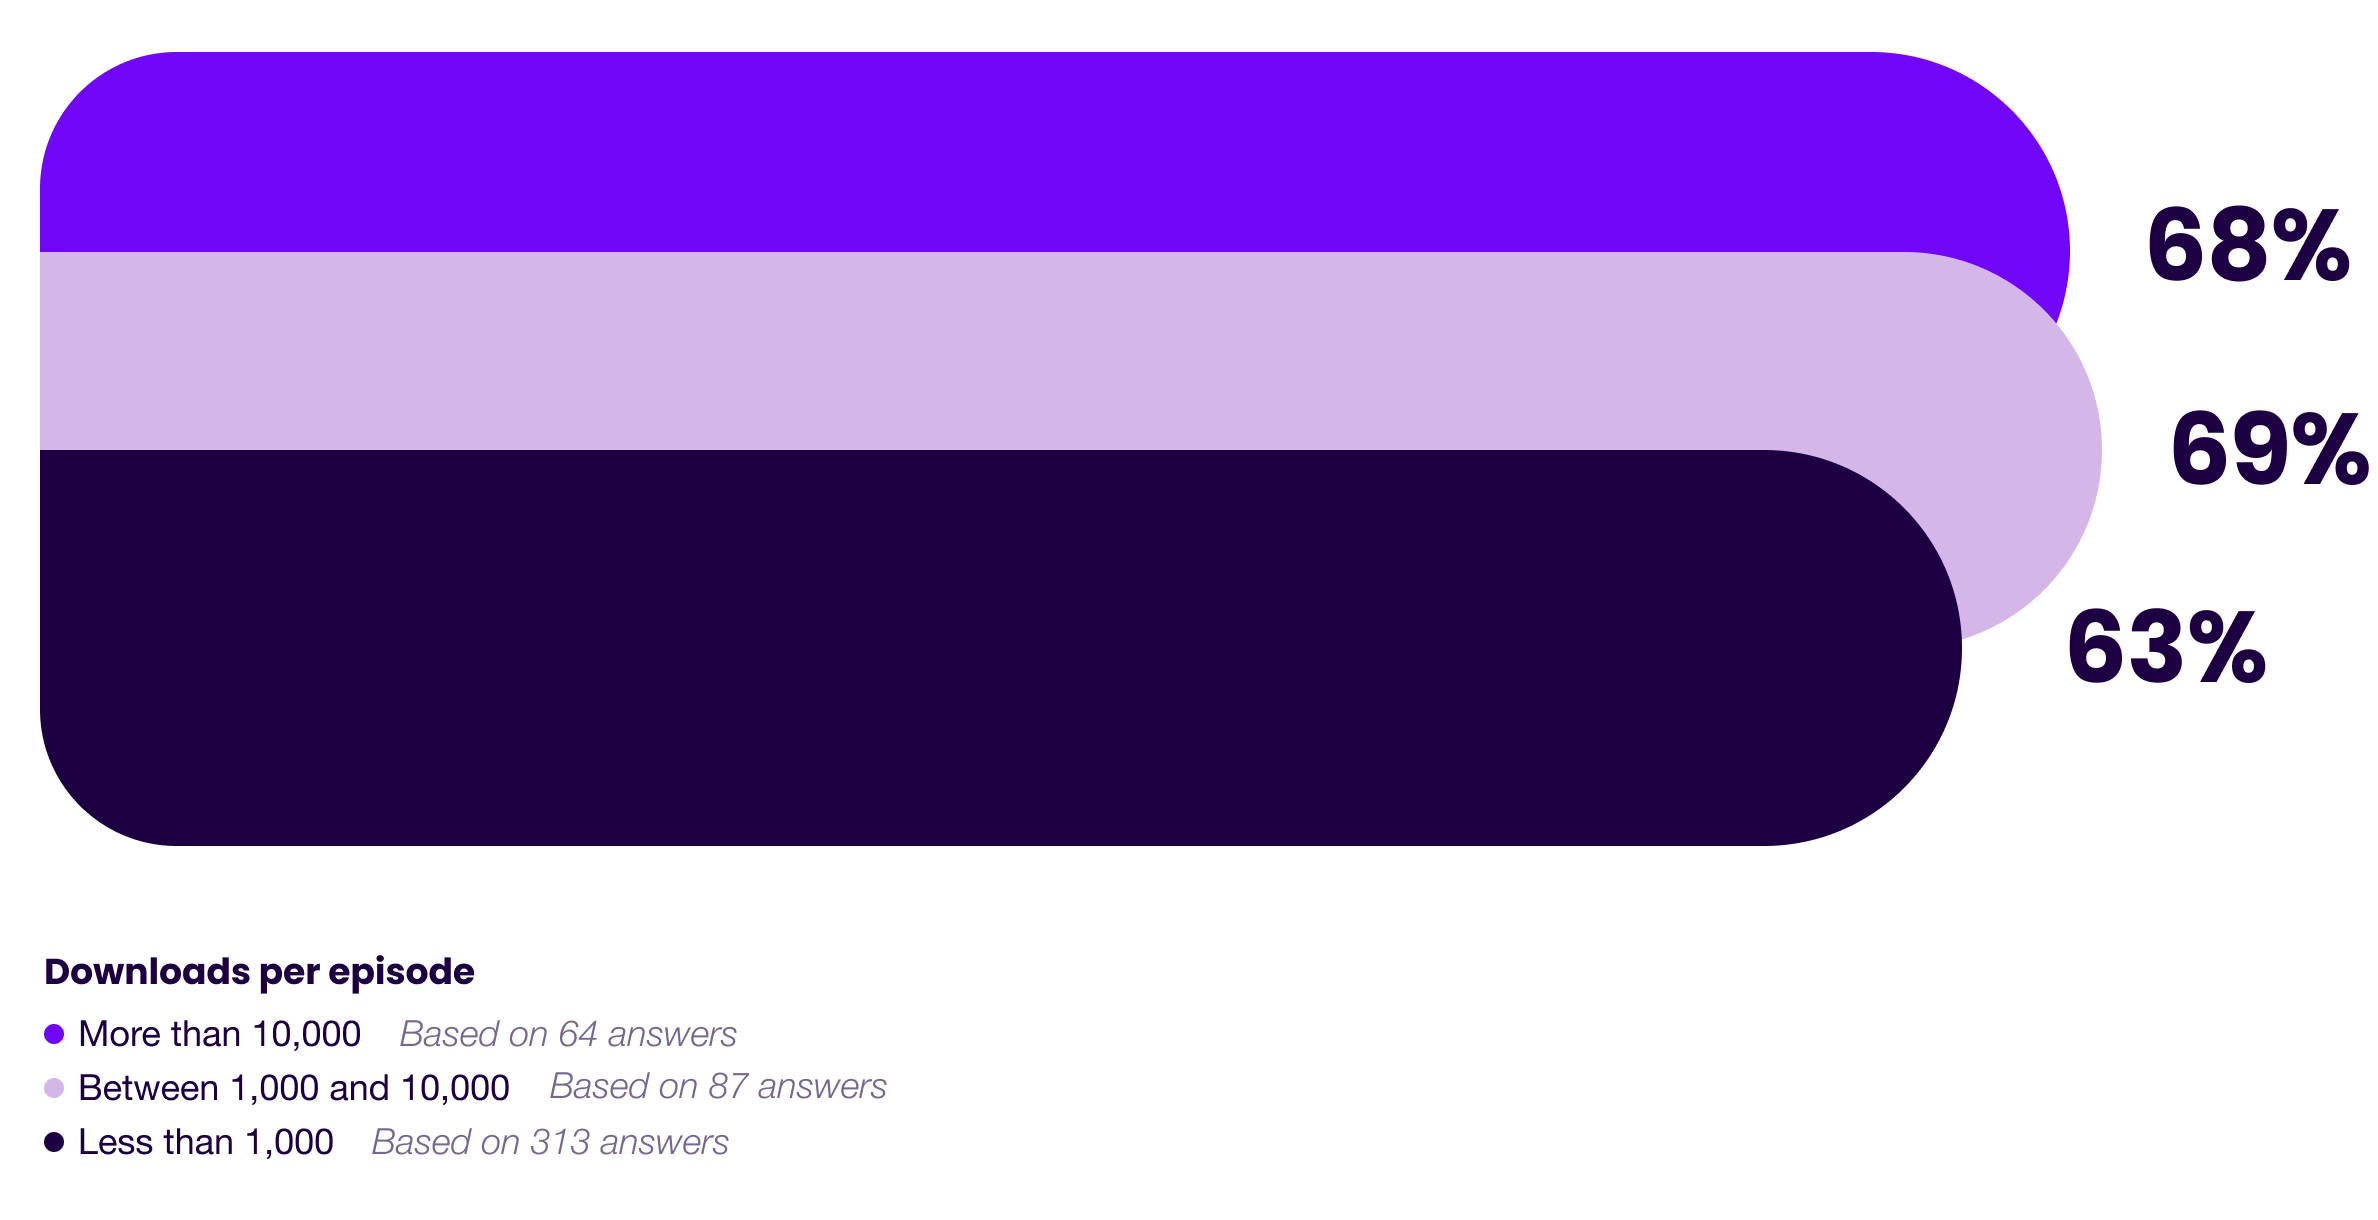
65.8%
Average episode consumption rate
Cross-Platform Audience Sizes
Given the lack of a universal in-built discovery engine for podcasting, it’s not surprising that podcasters in general are multi-platform creators.
In fact, of our 521 respondents, only one indicated that they were not active on any other marketing platforms.
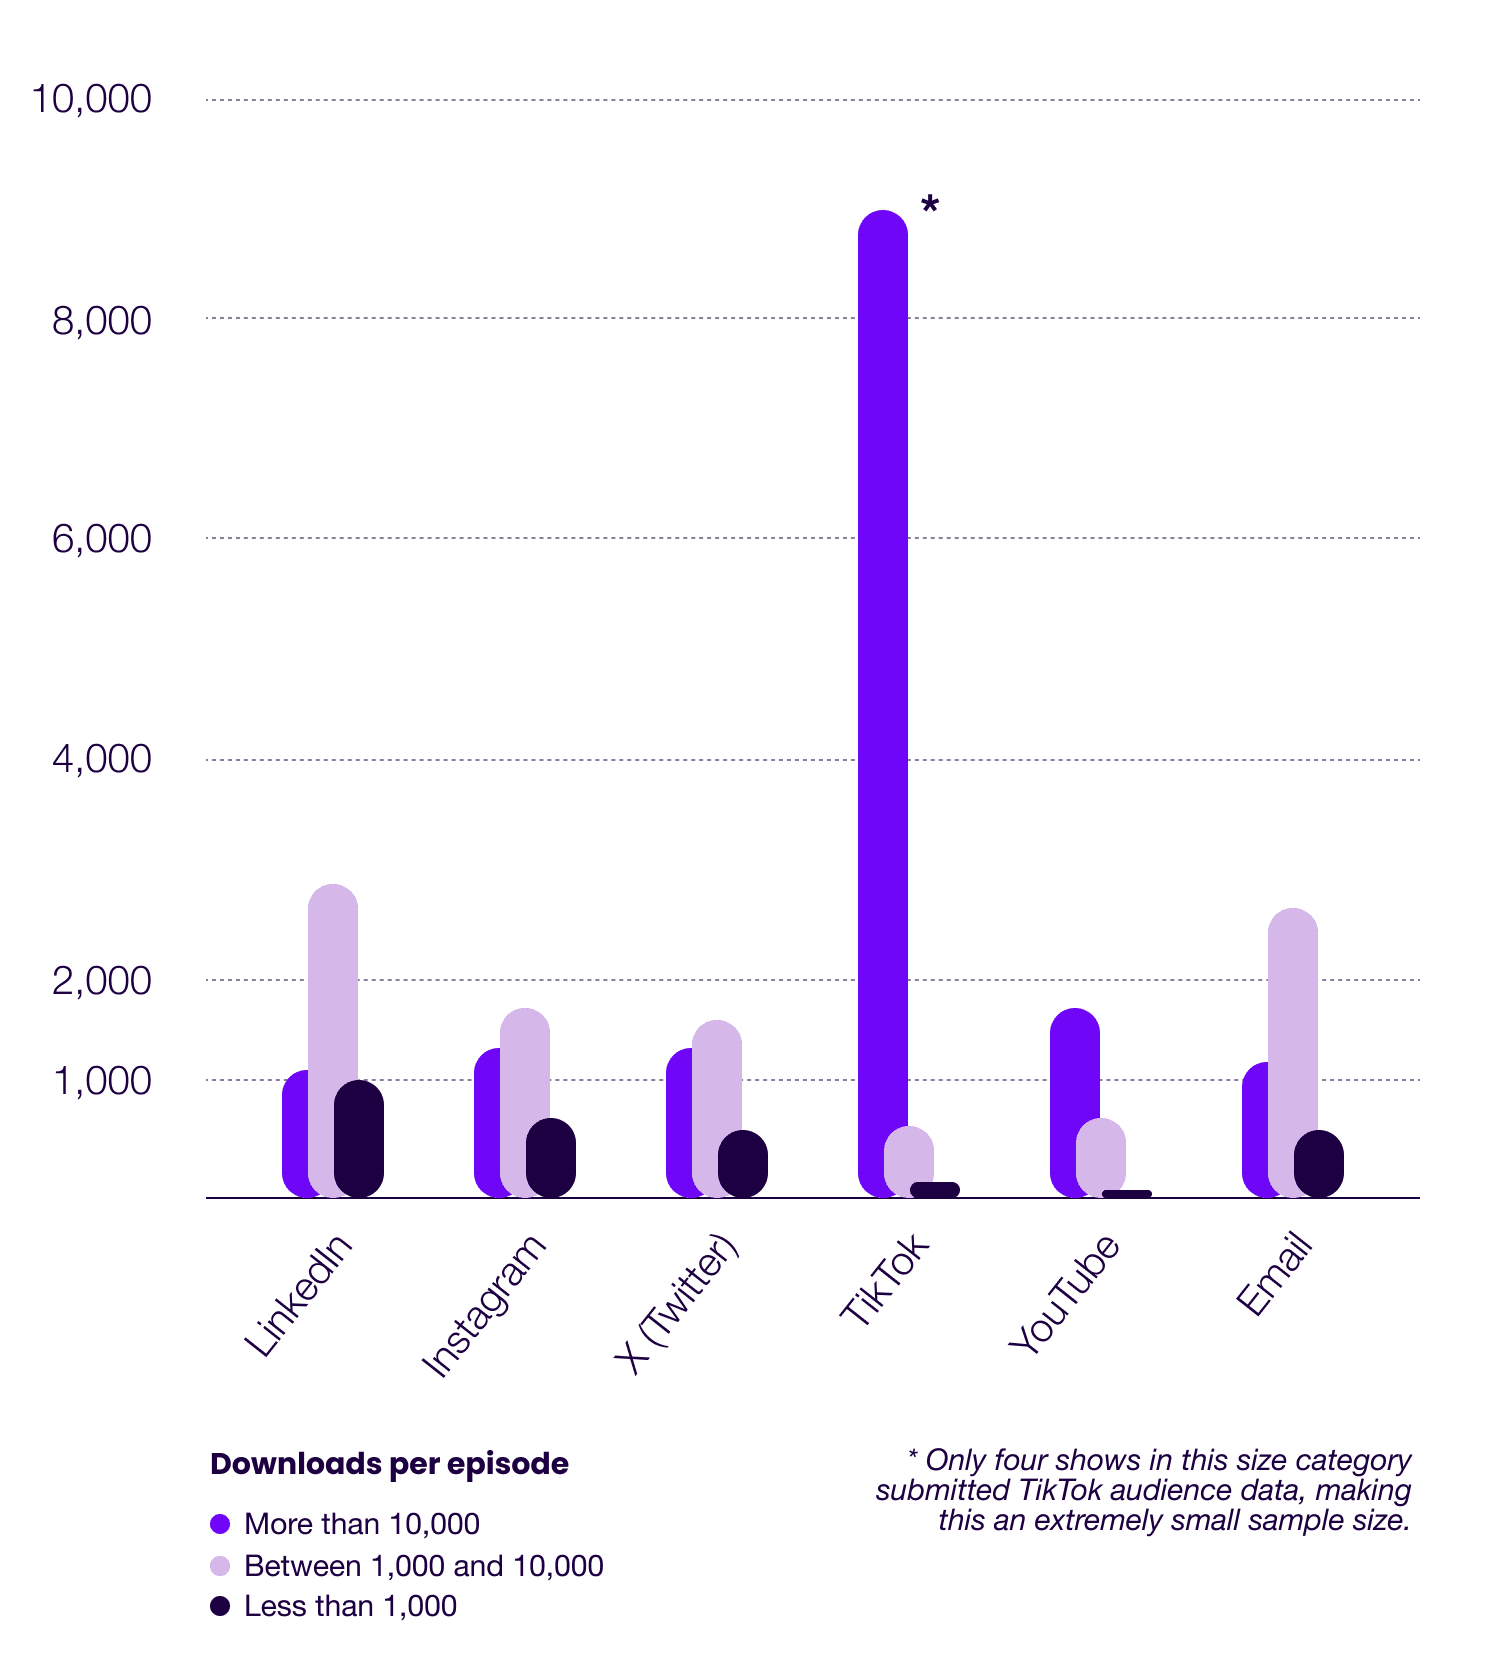
When it comes to supplementary content platforms, here’s how our respondents are faring, based on the median follower/subscriber count for each platform in our data set.
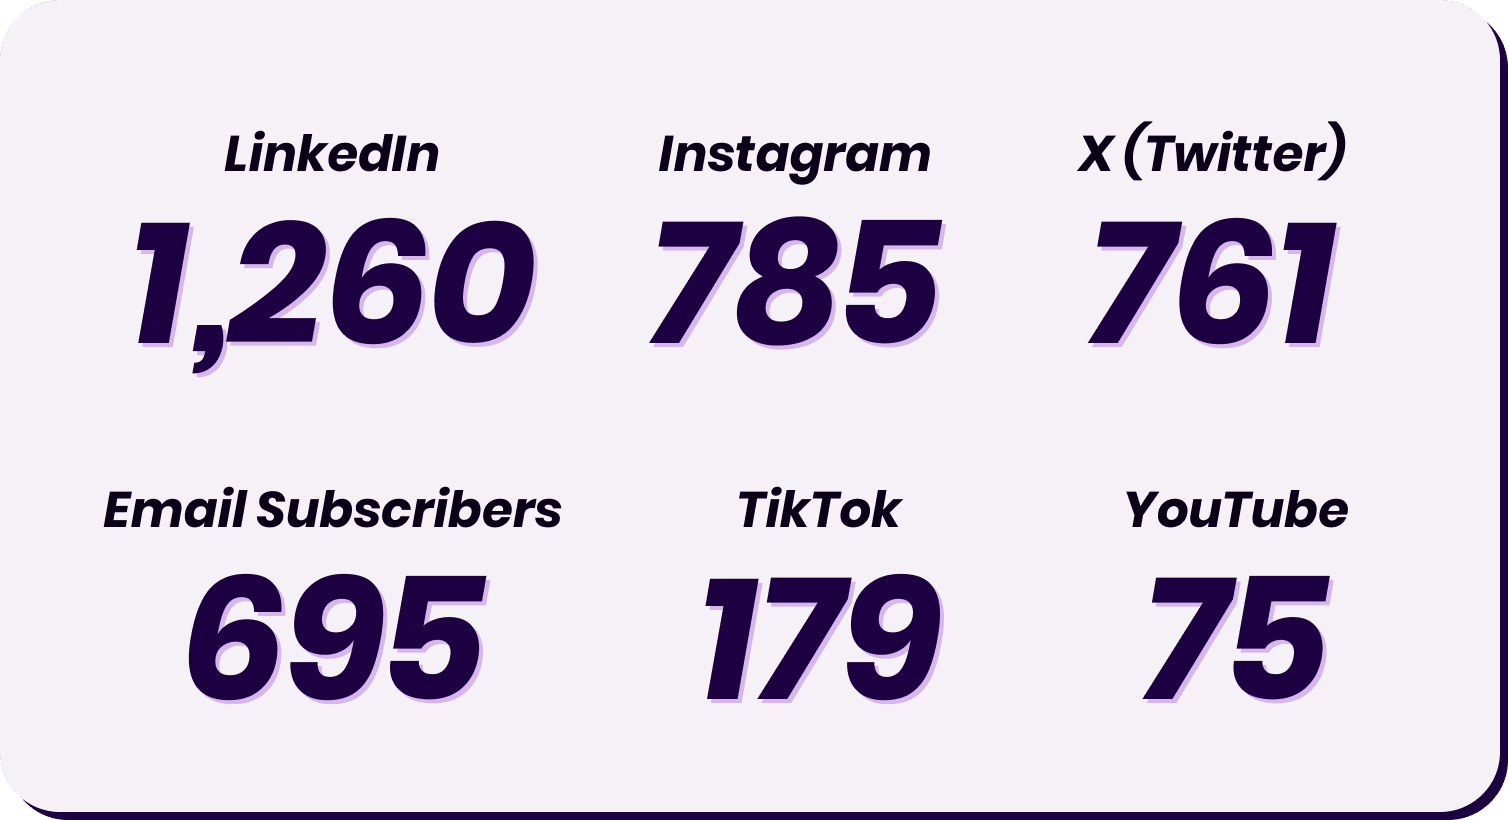
1,260
Email Subscribers
695
785
TikTok
179
X (Twitter)
761
YouTube
75
Cross-Platform Audience By Show Size
Key Takeaway
Mid-size shows consistently had the largest audiences on non-podcast platforms, with two exceptions, TikTok and YouTube, where the biggest shows had significantly larger audiences.
Is it a coincidence that these are the two platforms with arguably the best discovery algorithms?
Maybe, maybe not.
Before you double down on either of these platforms, however, consider this:
Anecdotal data has consistently shown that while it’s objectively easier to get discovered on both YouTube and TikTok, it’s ridiculously hard to convert those followers into podcast listeners.
Demystify Podcast Marketing
This report is just the start. Sign up to get a steady stream of (often unorthodox) podcast growth & marketing ideas through our Scrappy Podcasting Newsletter.
03
Show Attributes Correlation with Size
There’s a lot to be said about the impact that specific marketing strategies and tactics have on growth. And we’ll get there.
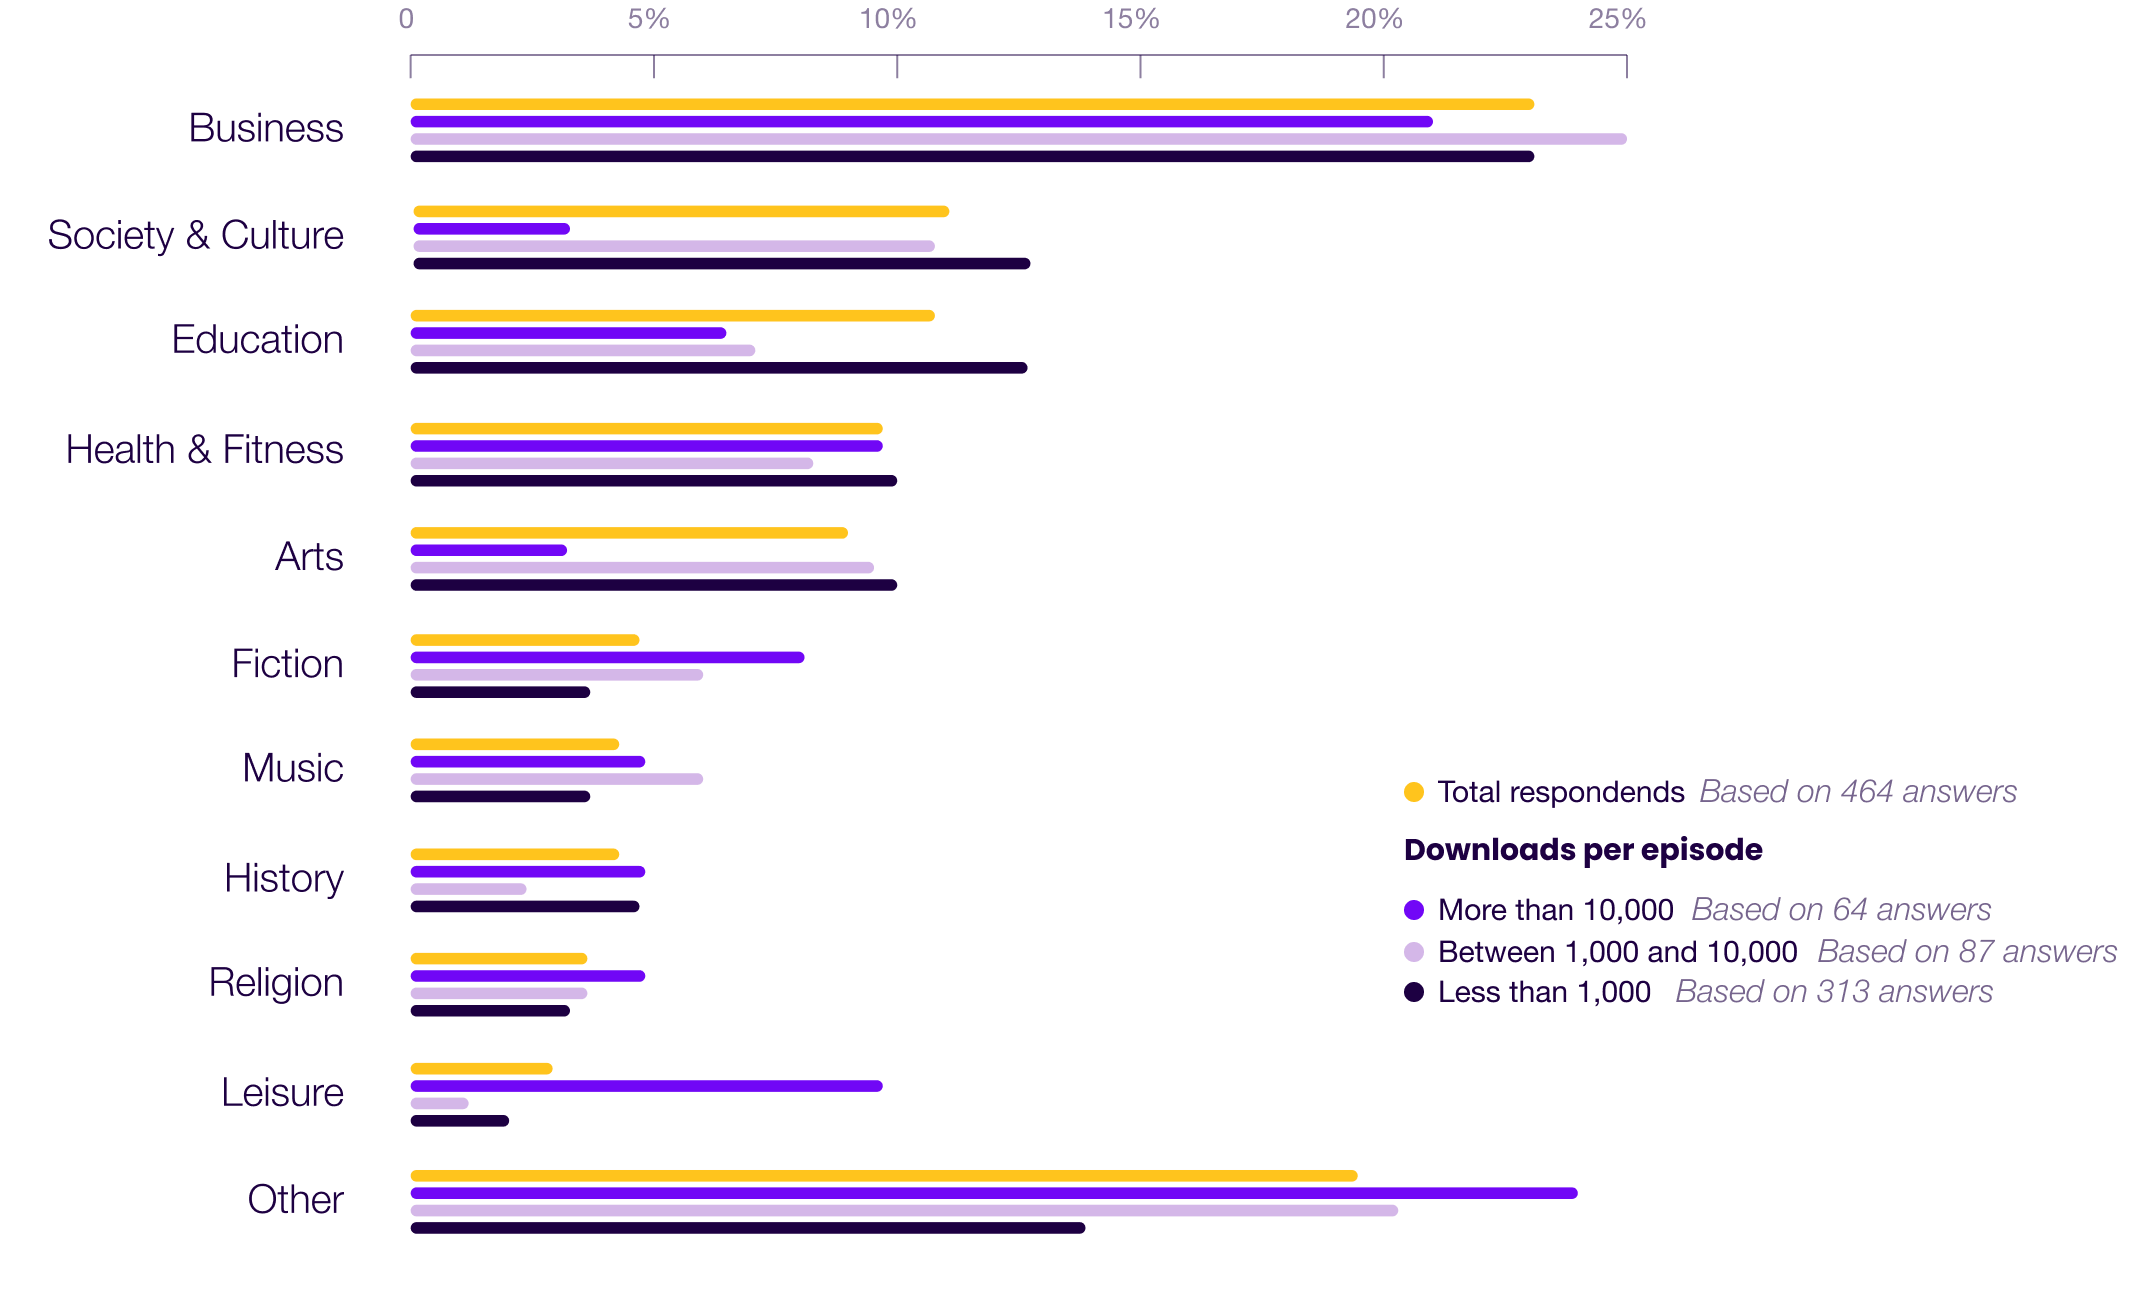
But before we get to the tactical stuff, we wanted to look into various attributes that are inherent to a show and their correlation with size.
Show Topic By Size
>10k Trends
Compared to the overall average, shows averaging more than 10k dl/ep are:
📈 Significantly more likely to be in the Fiction and Leisure categories.
📉 Significantly less likely to be in the Society & Culture, Education, and Arts categories.
1k–10k Trends
Compared to the overall average, shows averaging 1k–10k dl/ep are:
📈 Moderately more likely to be in the Business, Fiction, and Music categories.
📉 Significantly less likely to be in the Education, History, and Leisure categories.
<1k Trends
Compared to the overall average, shows averaging less than 1k dl/ep are:
📈 Moderately more likely to be in the Society & Culture and Education categories.
📉 Moderately less likely to be in the Fiction and Leisure categories.
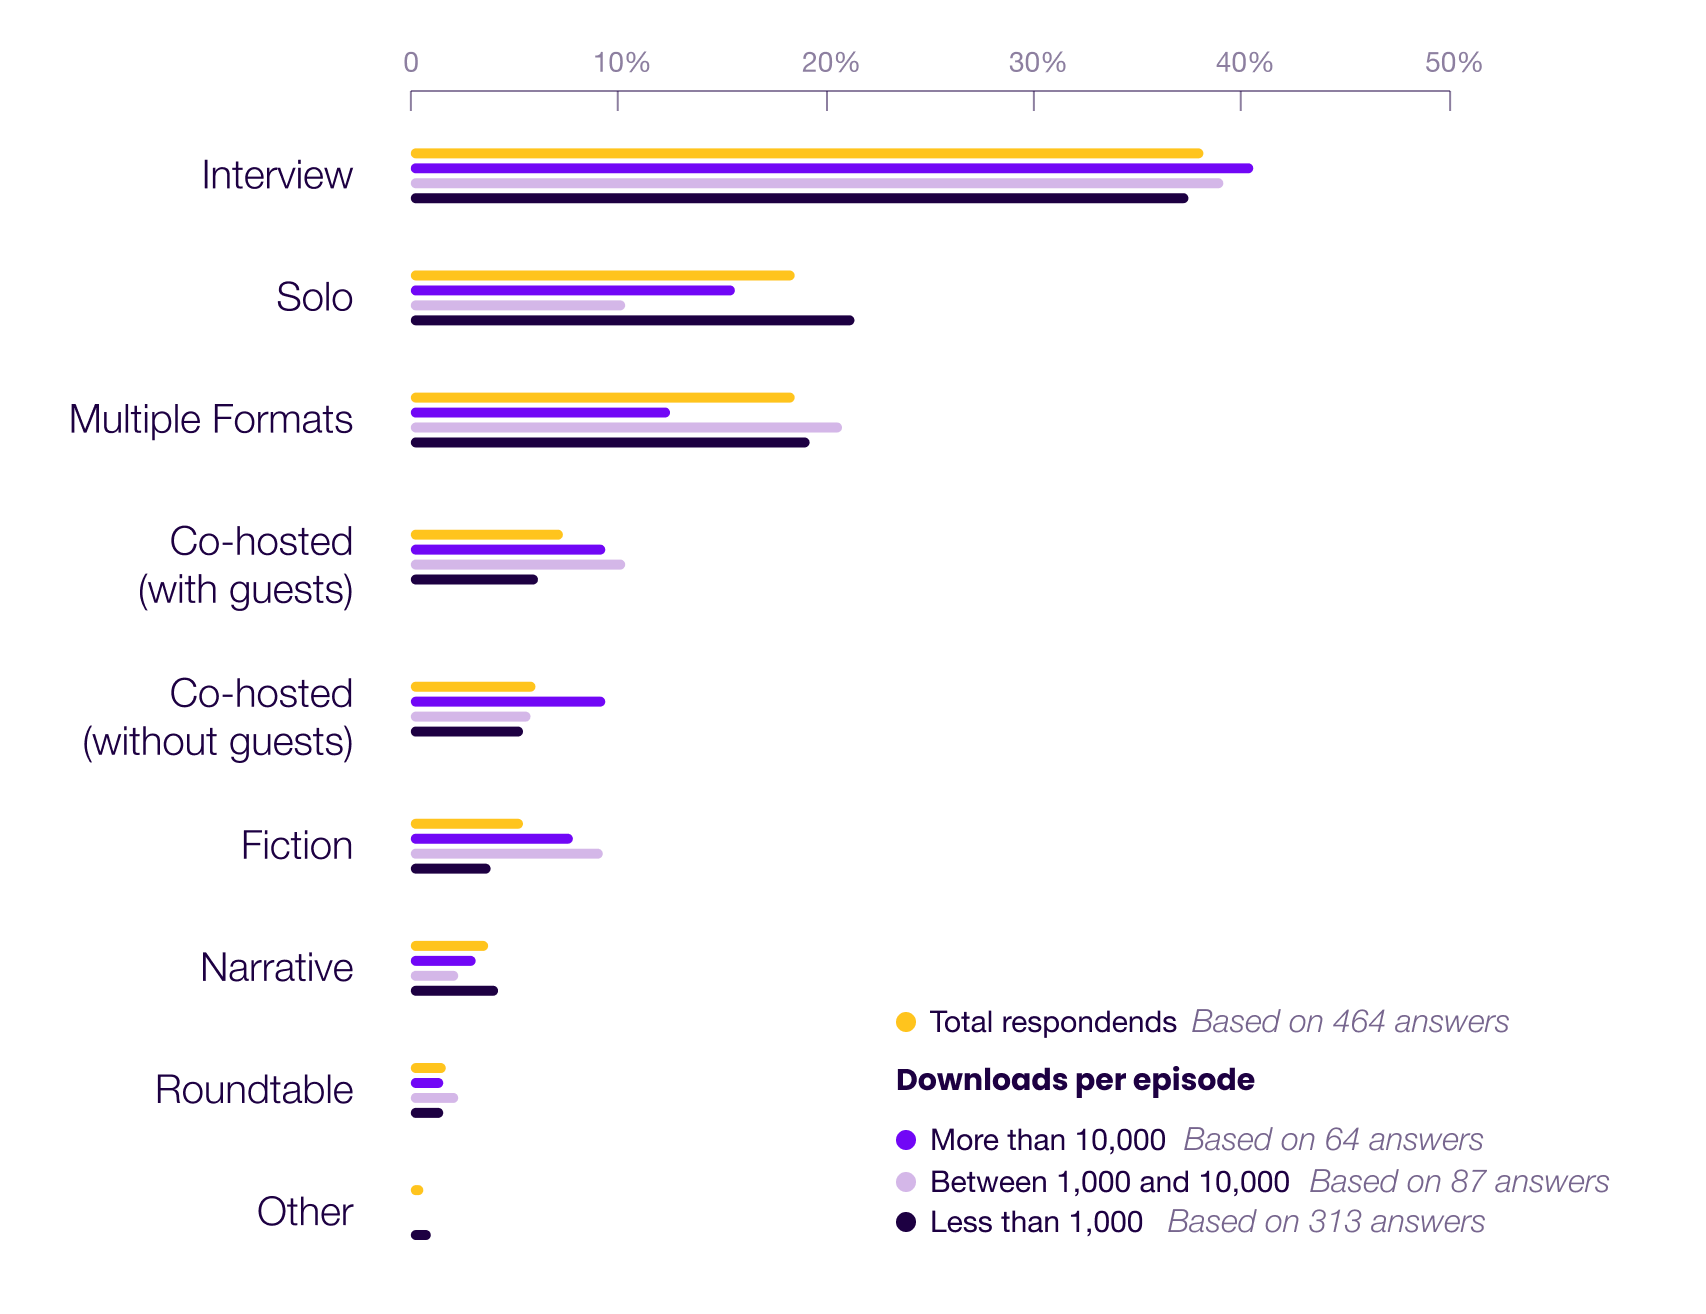
Show Format By Size
>10k Trends
Compared to the overall average, shows averaging more than 10k dl/ep are:
📈 Significantly more likely to be cohosted (without guests) or fiction as their primary format.
📉 Significantly less likely to feature multiple formats.
1k–10k Trends
Compared to the overall average, shows averaging 1k–10k dl/ep are:
📈 Significantly more likely to be cohosted (with guests) or fiction as their primary format.
📉 Significantly less likely to feature solo or narrative formats.
<1k Trends
Compared to the overall average, shows averaging less than 1k dl/ep are:
📈 Moderately more likely to feature solo episodes as their primary format.
📉 Moderately less likely to be cohosted (with guests) or fiction as their primary format.
Publish Frequency
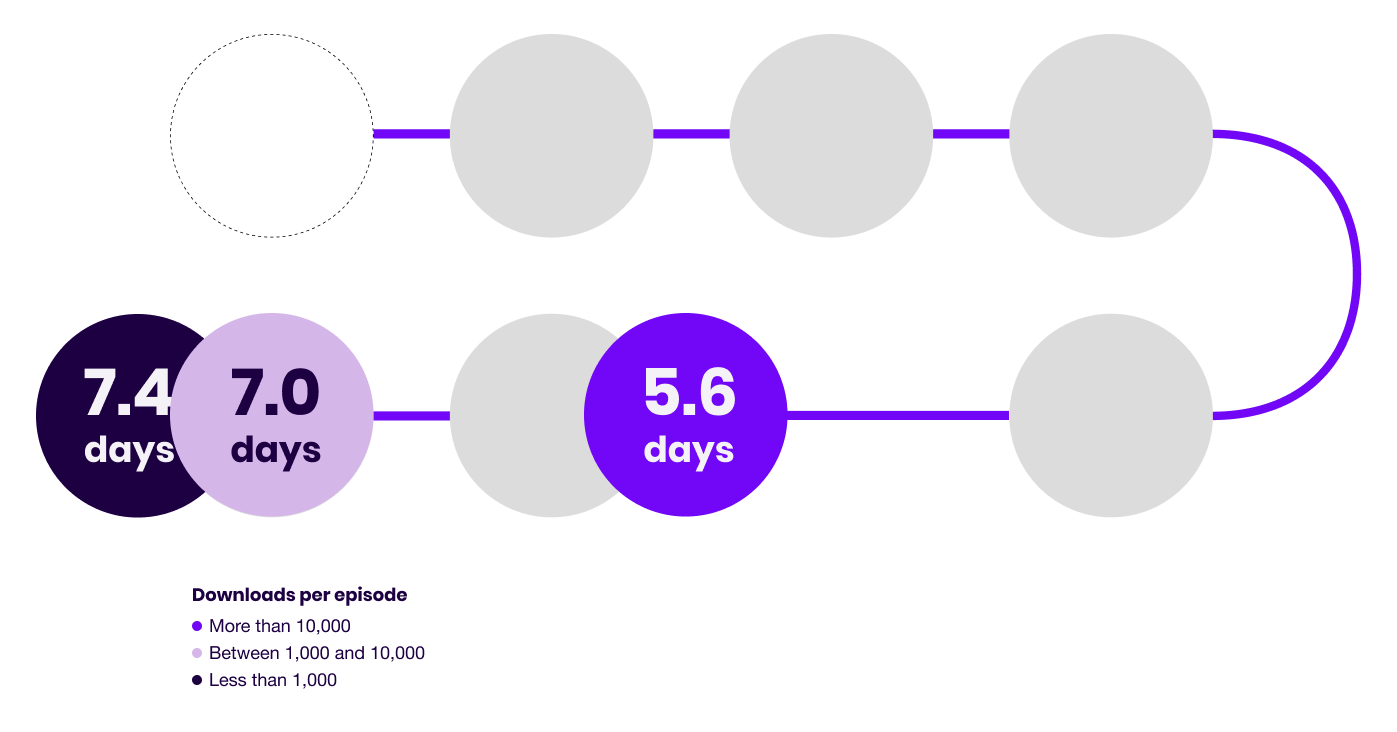
Among shows that actively published episodes throughout the year.
Seasonal shows, as well as new shows started over the course of the year or those that podfaded are excluded from this data point.
7.0
Median days between episodes
Key Takeaway
It’s tempting to look at the fact that the biggest shows tend to publish more frequently and determine that the secret to growth is to publish more episodes yourself.
As previously highlighted, however, more than 46% of shows averaging more than 10k dl/ep actually shrank on a downloads-per-episode basis over the course of our survey.
This suggests publishing more episodes is not correlated with more listeners.
So what’s going on here?
Our assessment:
Shows averaging more than 10k dl/ep are significantly more likely to have advertisers, most of which (at this level) operate on a CPM basis.
As a result, shows that are closely tied to this monetization model are primarily incentivized to increase ad impressions, and thus, their revenue.
There are 3 ways to do this:
- Grow their subscriber base
- Insert more ads in each episode
- Create more episodes, thus creating more ad inventory without growing their actual audience
Compared to doubling your subscriber count, adding an extra episode (or 4!) per week (and thus 2–5x’ing your income) is a cakewalk.
The increased publishing frequency of large shows then, is more likely the sign of a show that is struggling to grow its subscriber base than a reason behind its growth.
Episode Length
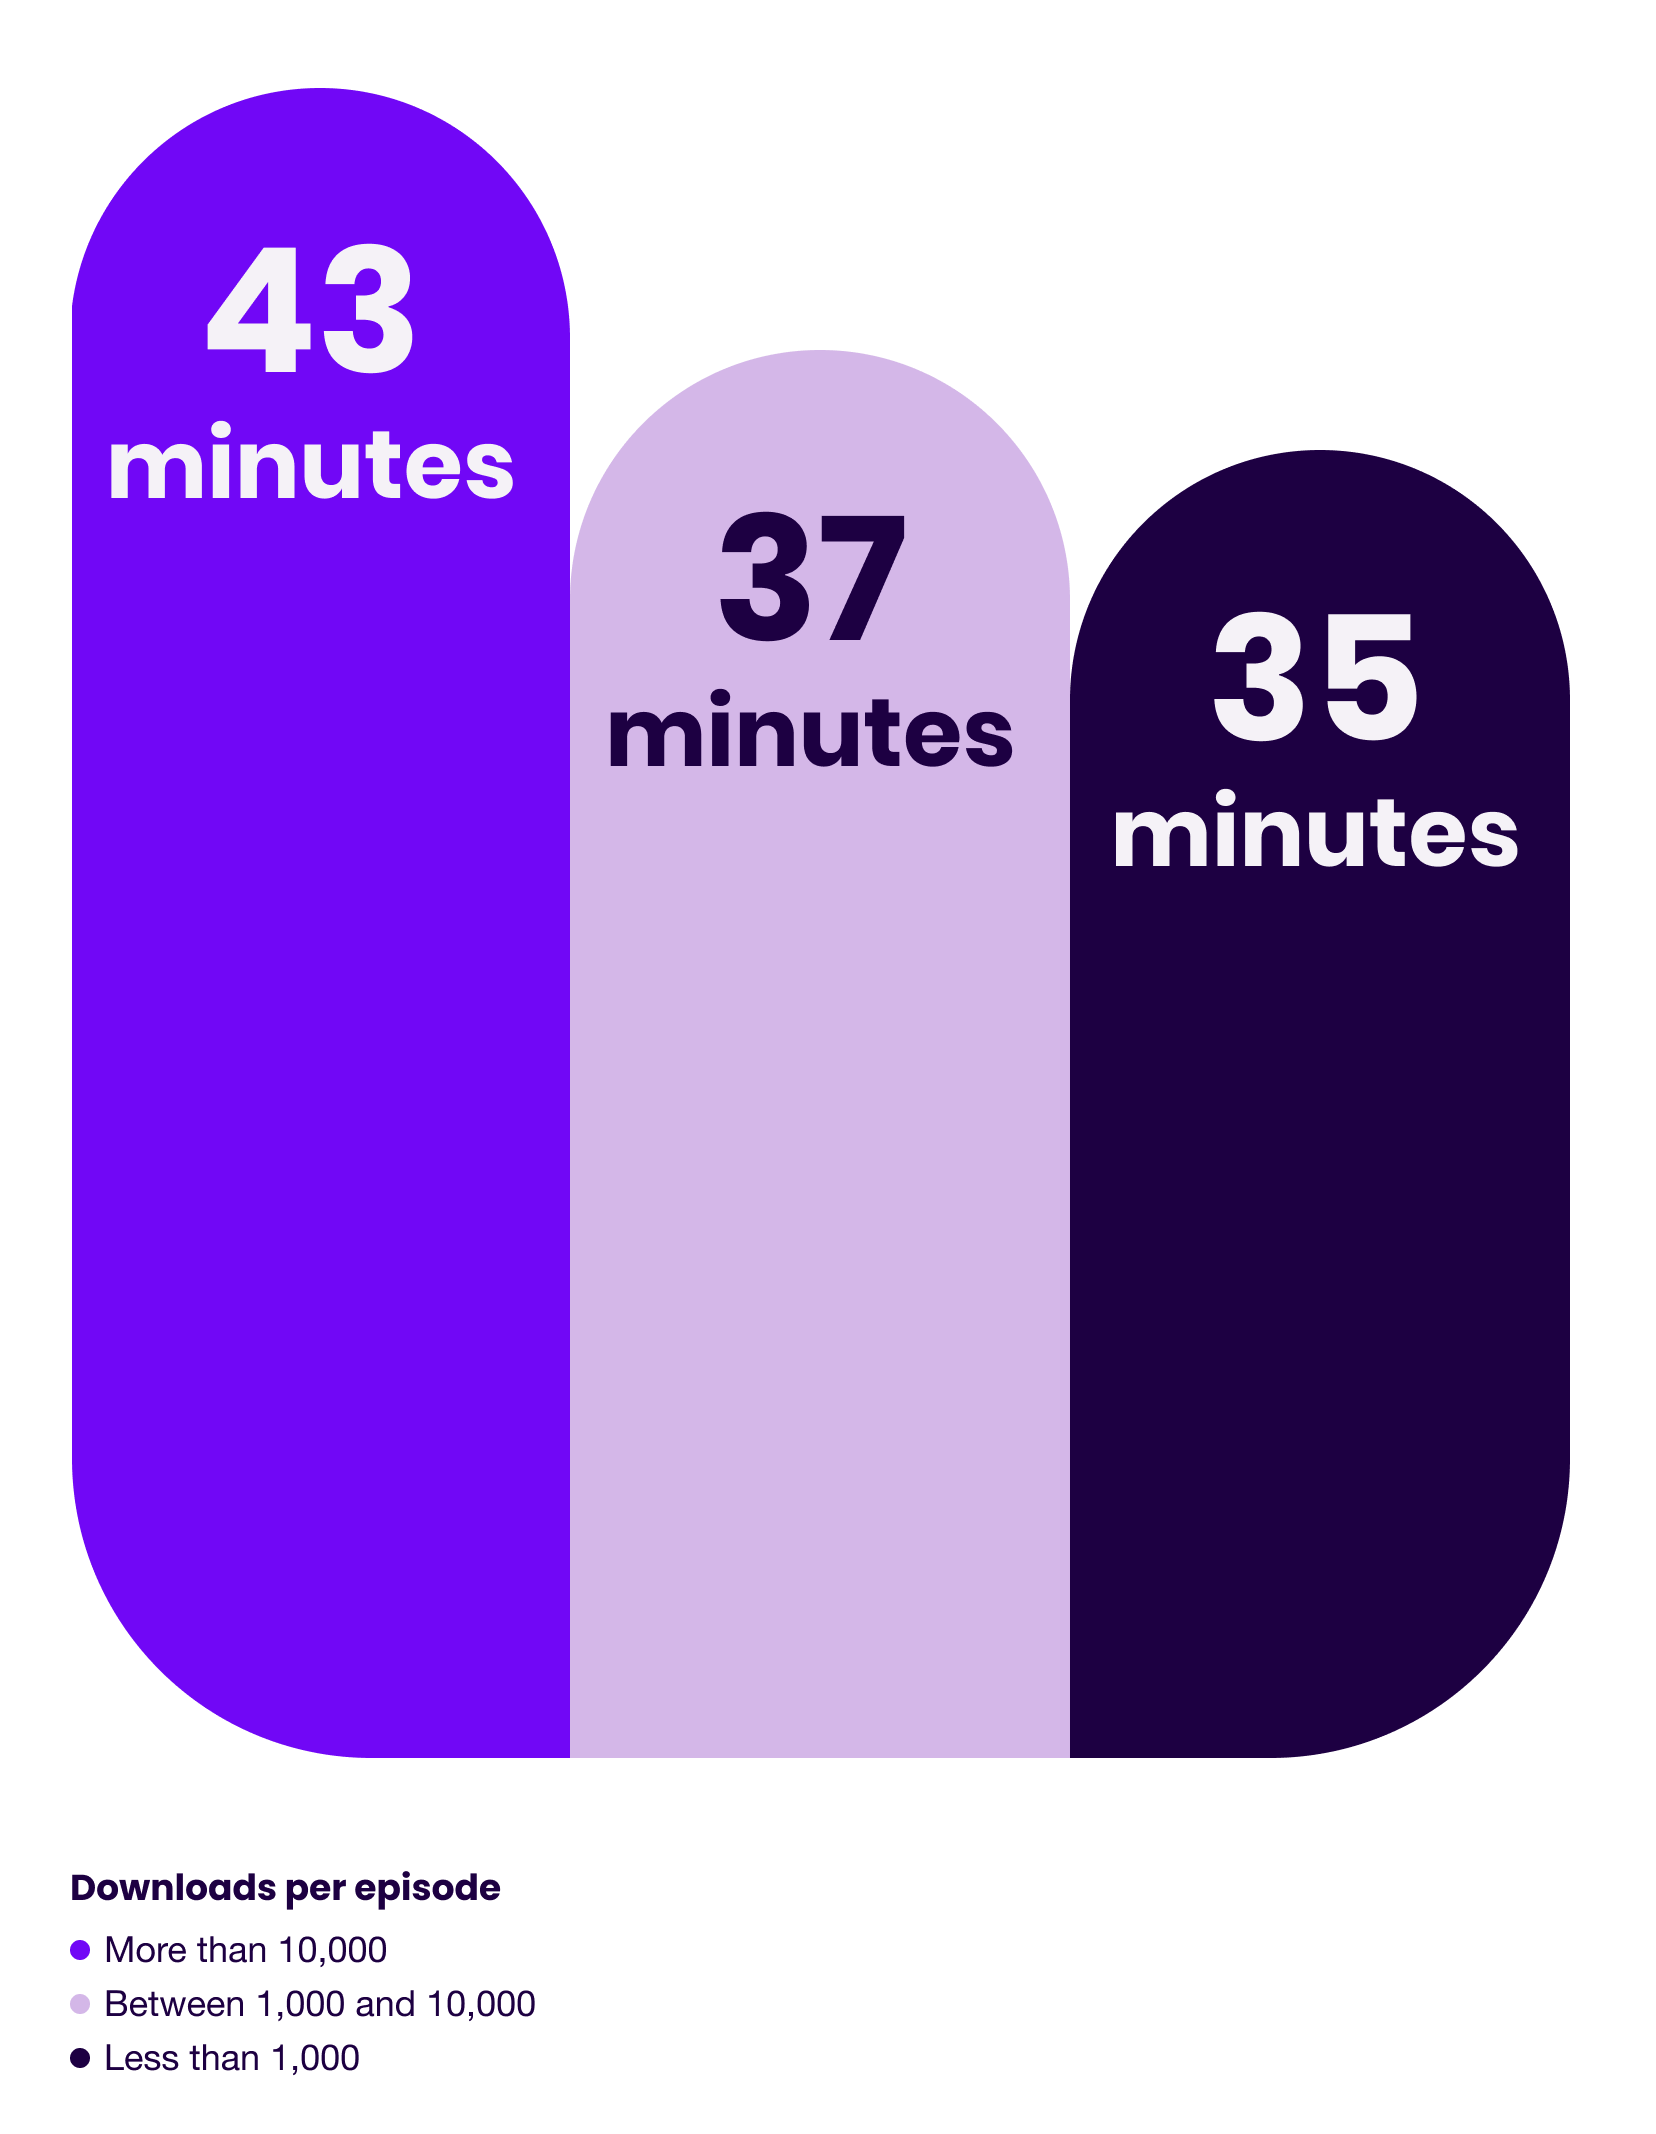
37
Median episode length in minutes
Episodes Published
66
Median number of episodes published overall

66
Median number of episodes published overall
Key Takeaway
It’s no surprise that the biggest shows have produced more episodes.
For one, shows that gain traction are more likely to keep producing episodes than those that don’t.
Second, the larger the back catalogue the greater the impact of back catalogue downloads on monthly download stats.
Third, more episodes mean more time spent honing your craft and more opportunities to experiment.
In our opinion, it’s the last bit that’s most important.
While we have nothing in the data to support this, our experience is that significant experimentation is a necessity when it comes to finding Podcast-Market-Creator Fit, which is a prerequisite for growth.
Which means if you haven’t found traction yet, it may be worth changing things up until you find something that clicks with your intended audience.
Stop Guessing. Start Growing.
This report is just the start. Sign up to get a steady stream of (often unorthodox) podcast growth & marketing ideas through our Scrappy Podcasting Newsletter.
04
What High-Growth Podcasts Do Differently
There’s a lot to be said about the impact that specific marketing strategies and tactics have on growth. And we’ll get there.
But before we get to the tactical stuff, we wanted to look into various attributes that are inherent to a show and their correlation with size.
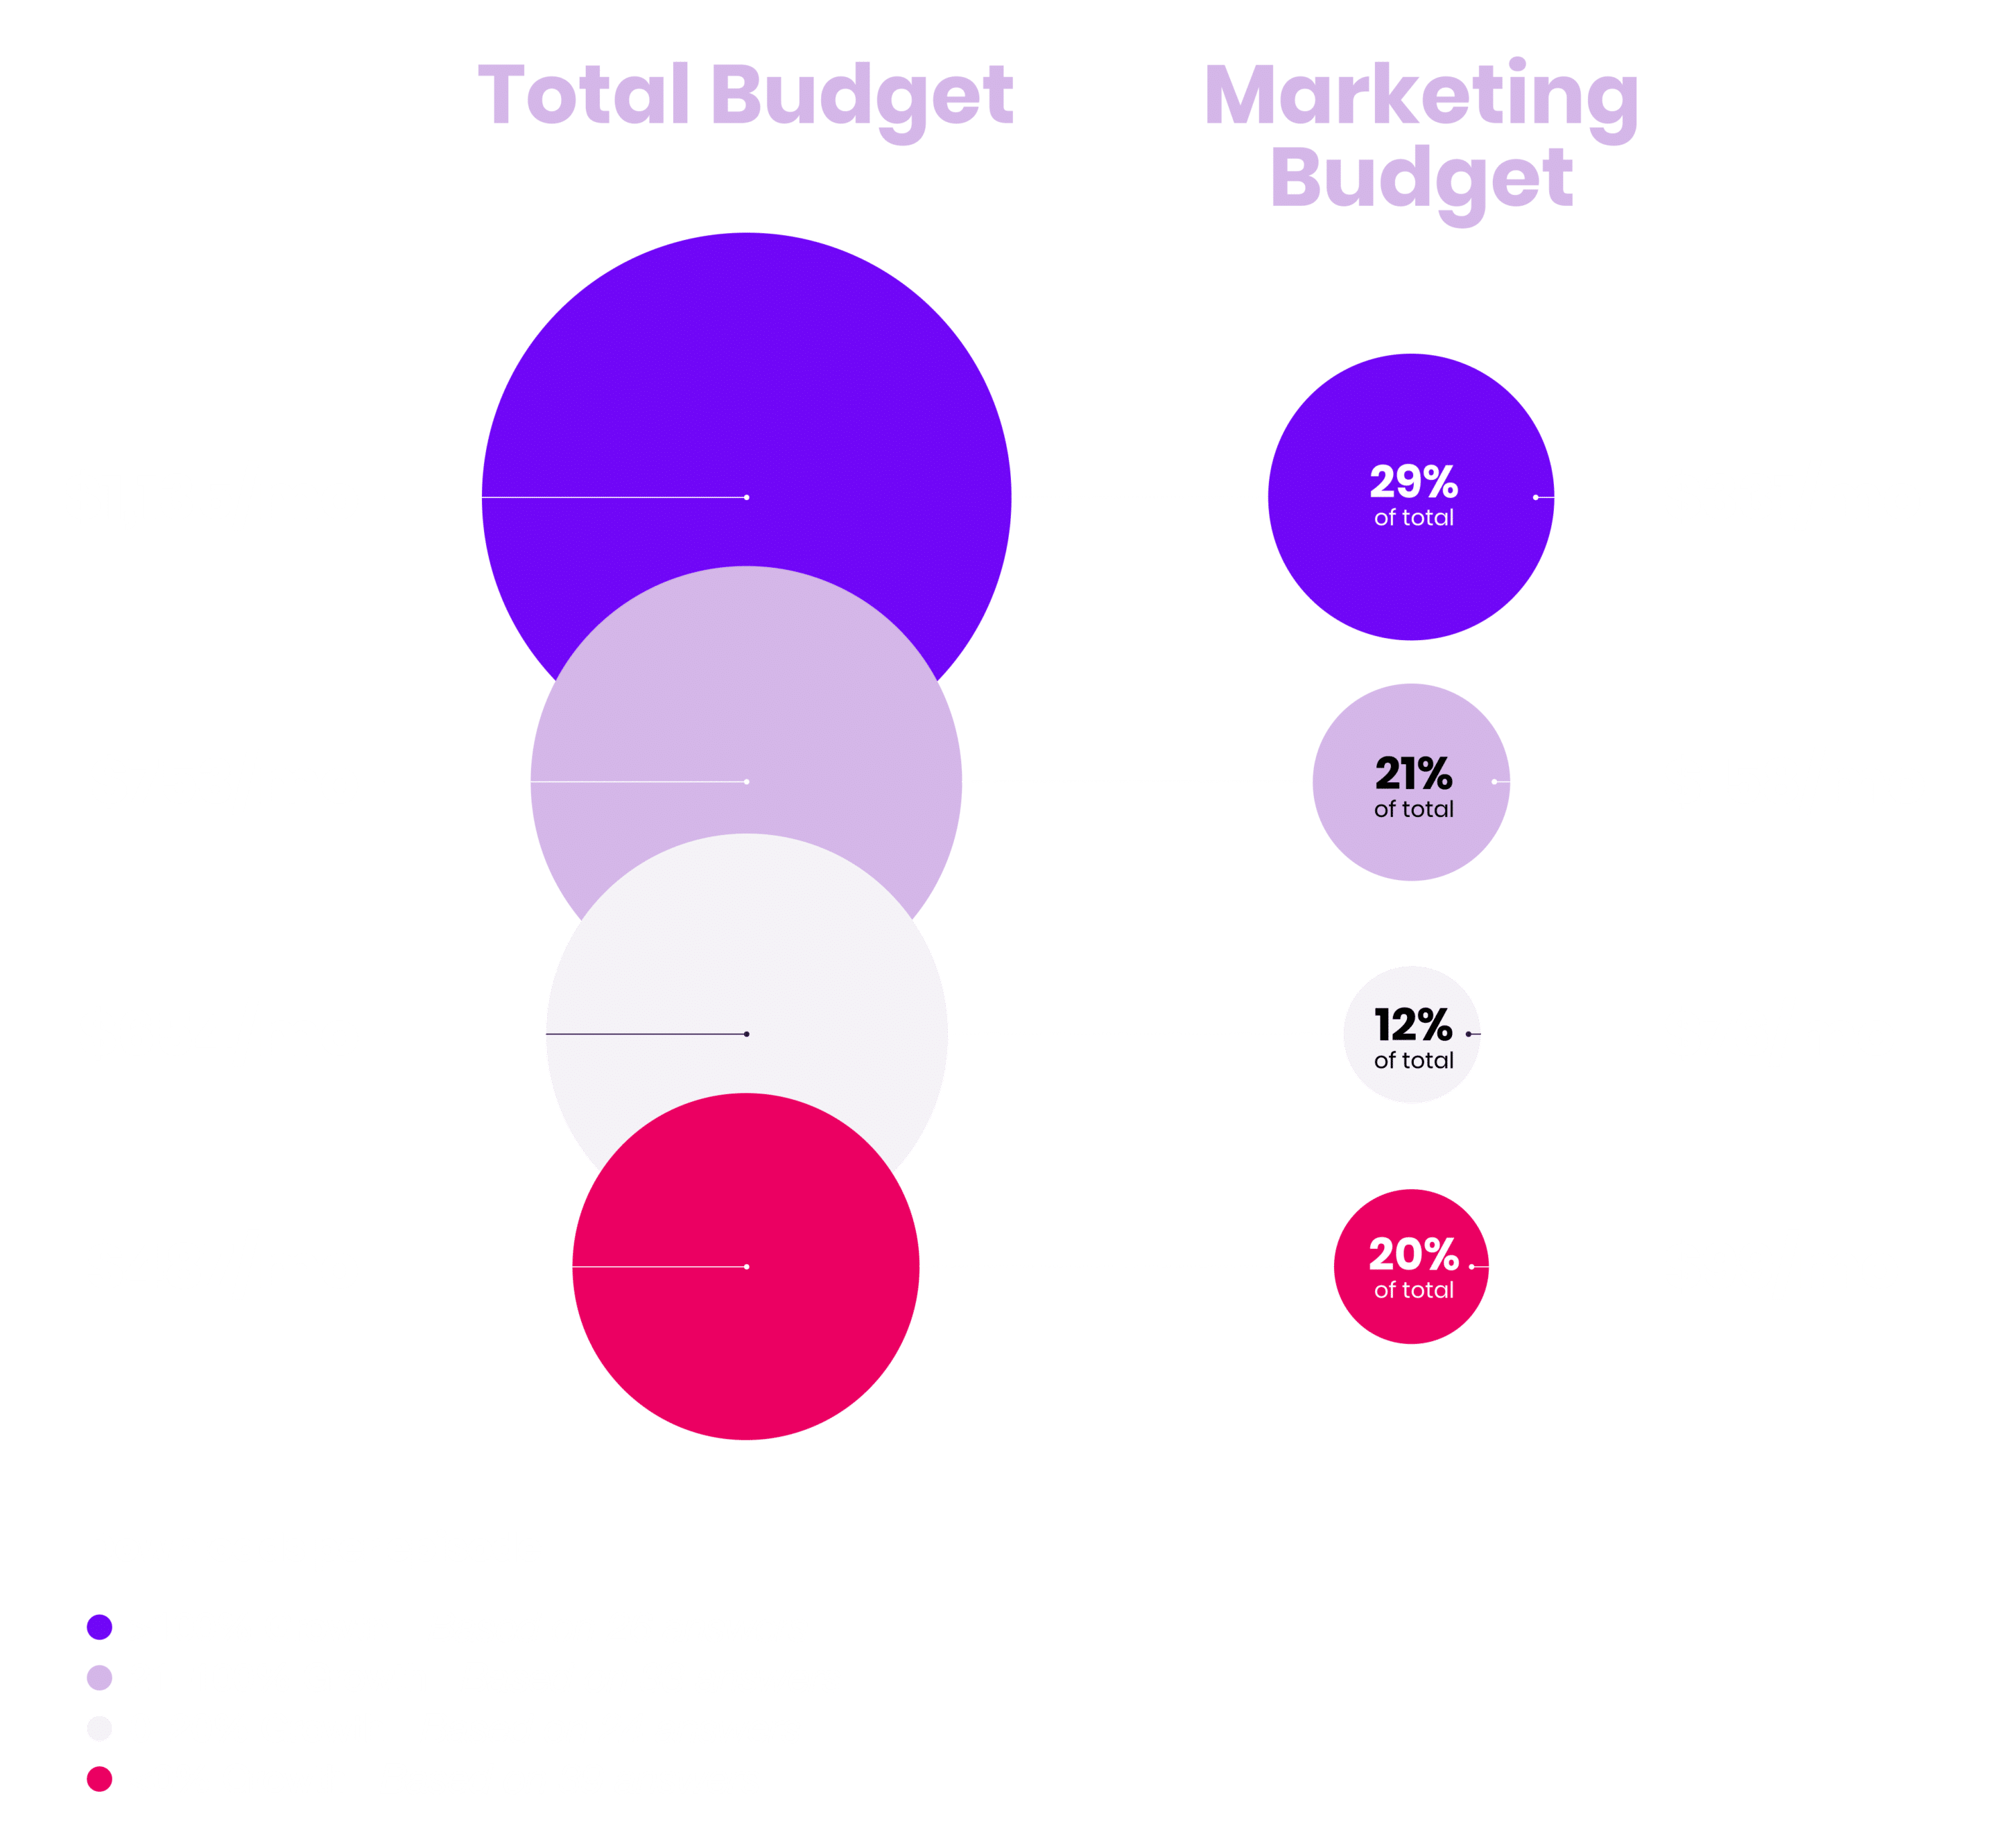
Monthly Podcasting Budget
Key Takeaway
At first glance, it seems clear that budget is a key component of growth.
But there’s an important caveat.
There was one show in the high-growth category that had a monthly budget of around $17,500, which skewed the entire group.
Without that show, the remainder of the highest growth shows had a monthly budget of only $480, the lowest of any growth category.
While there’s no denying that having a budget can make it easier on the host, it’s clearly not everything when it comes to growth.
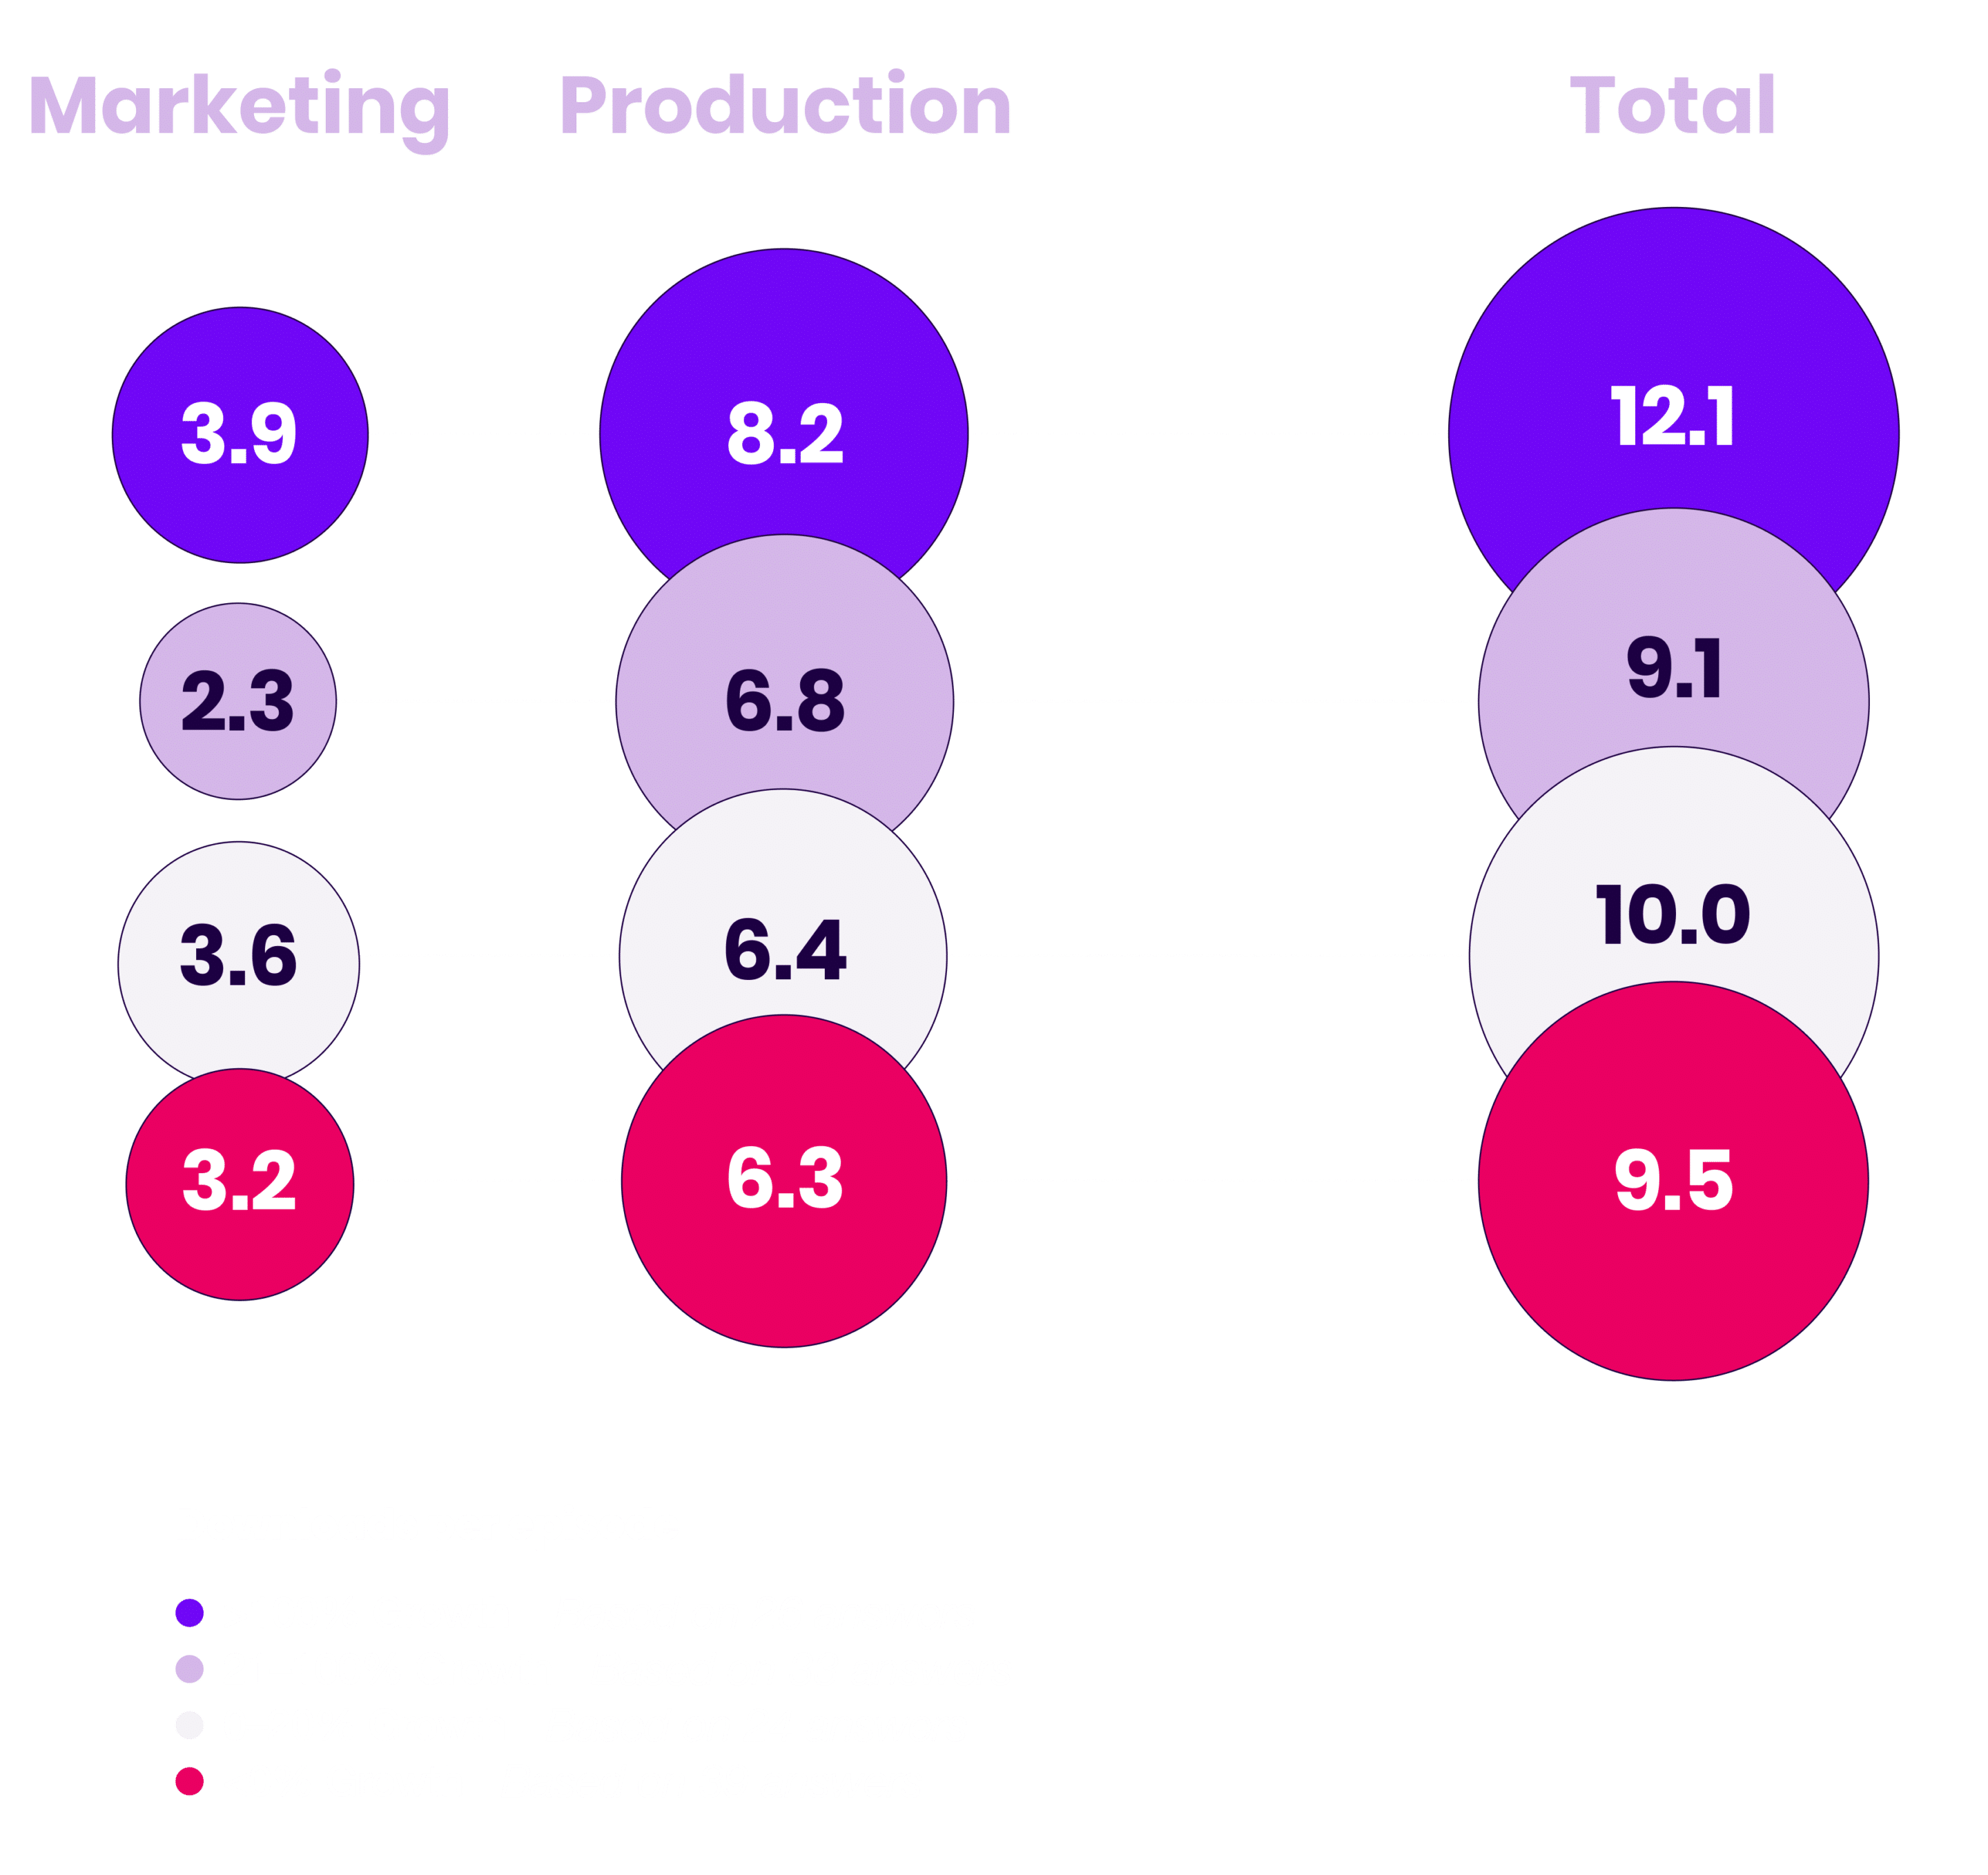
Weekly Time Investment
Key Takeaway
No surprises here: More work = more growth.
When it came to the highest growth shows, it was clear that they invested more time into both the production of their shows, as well their marketing.
It’s worth noting that while bigger shows tended to release episodes more frequently, the same was not true for high-growth shows, with all categories of growth releasing an episode every 7 days on average.
This means high-growth shows invested more time into production and marketing on both an absolute and per-episode basis.
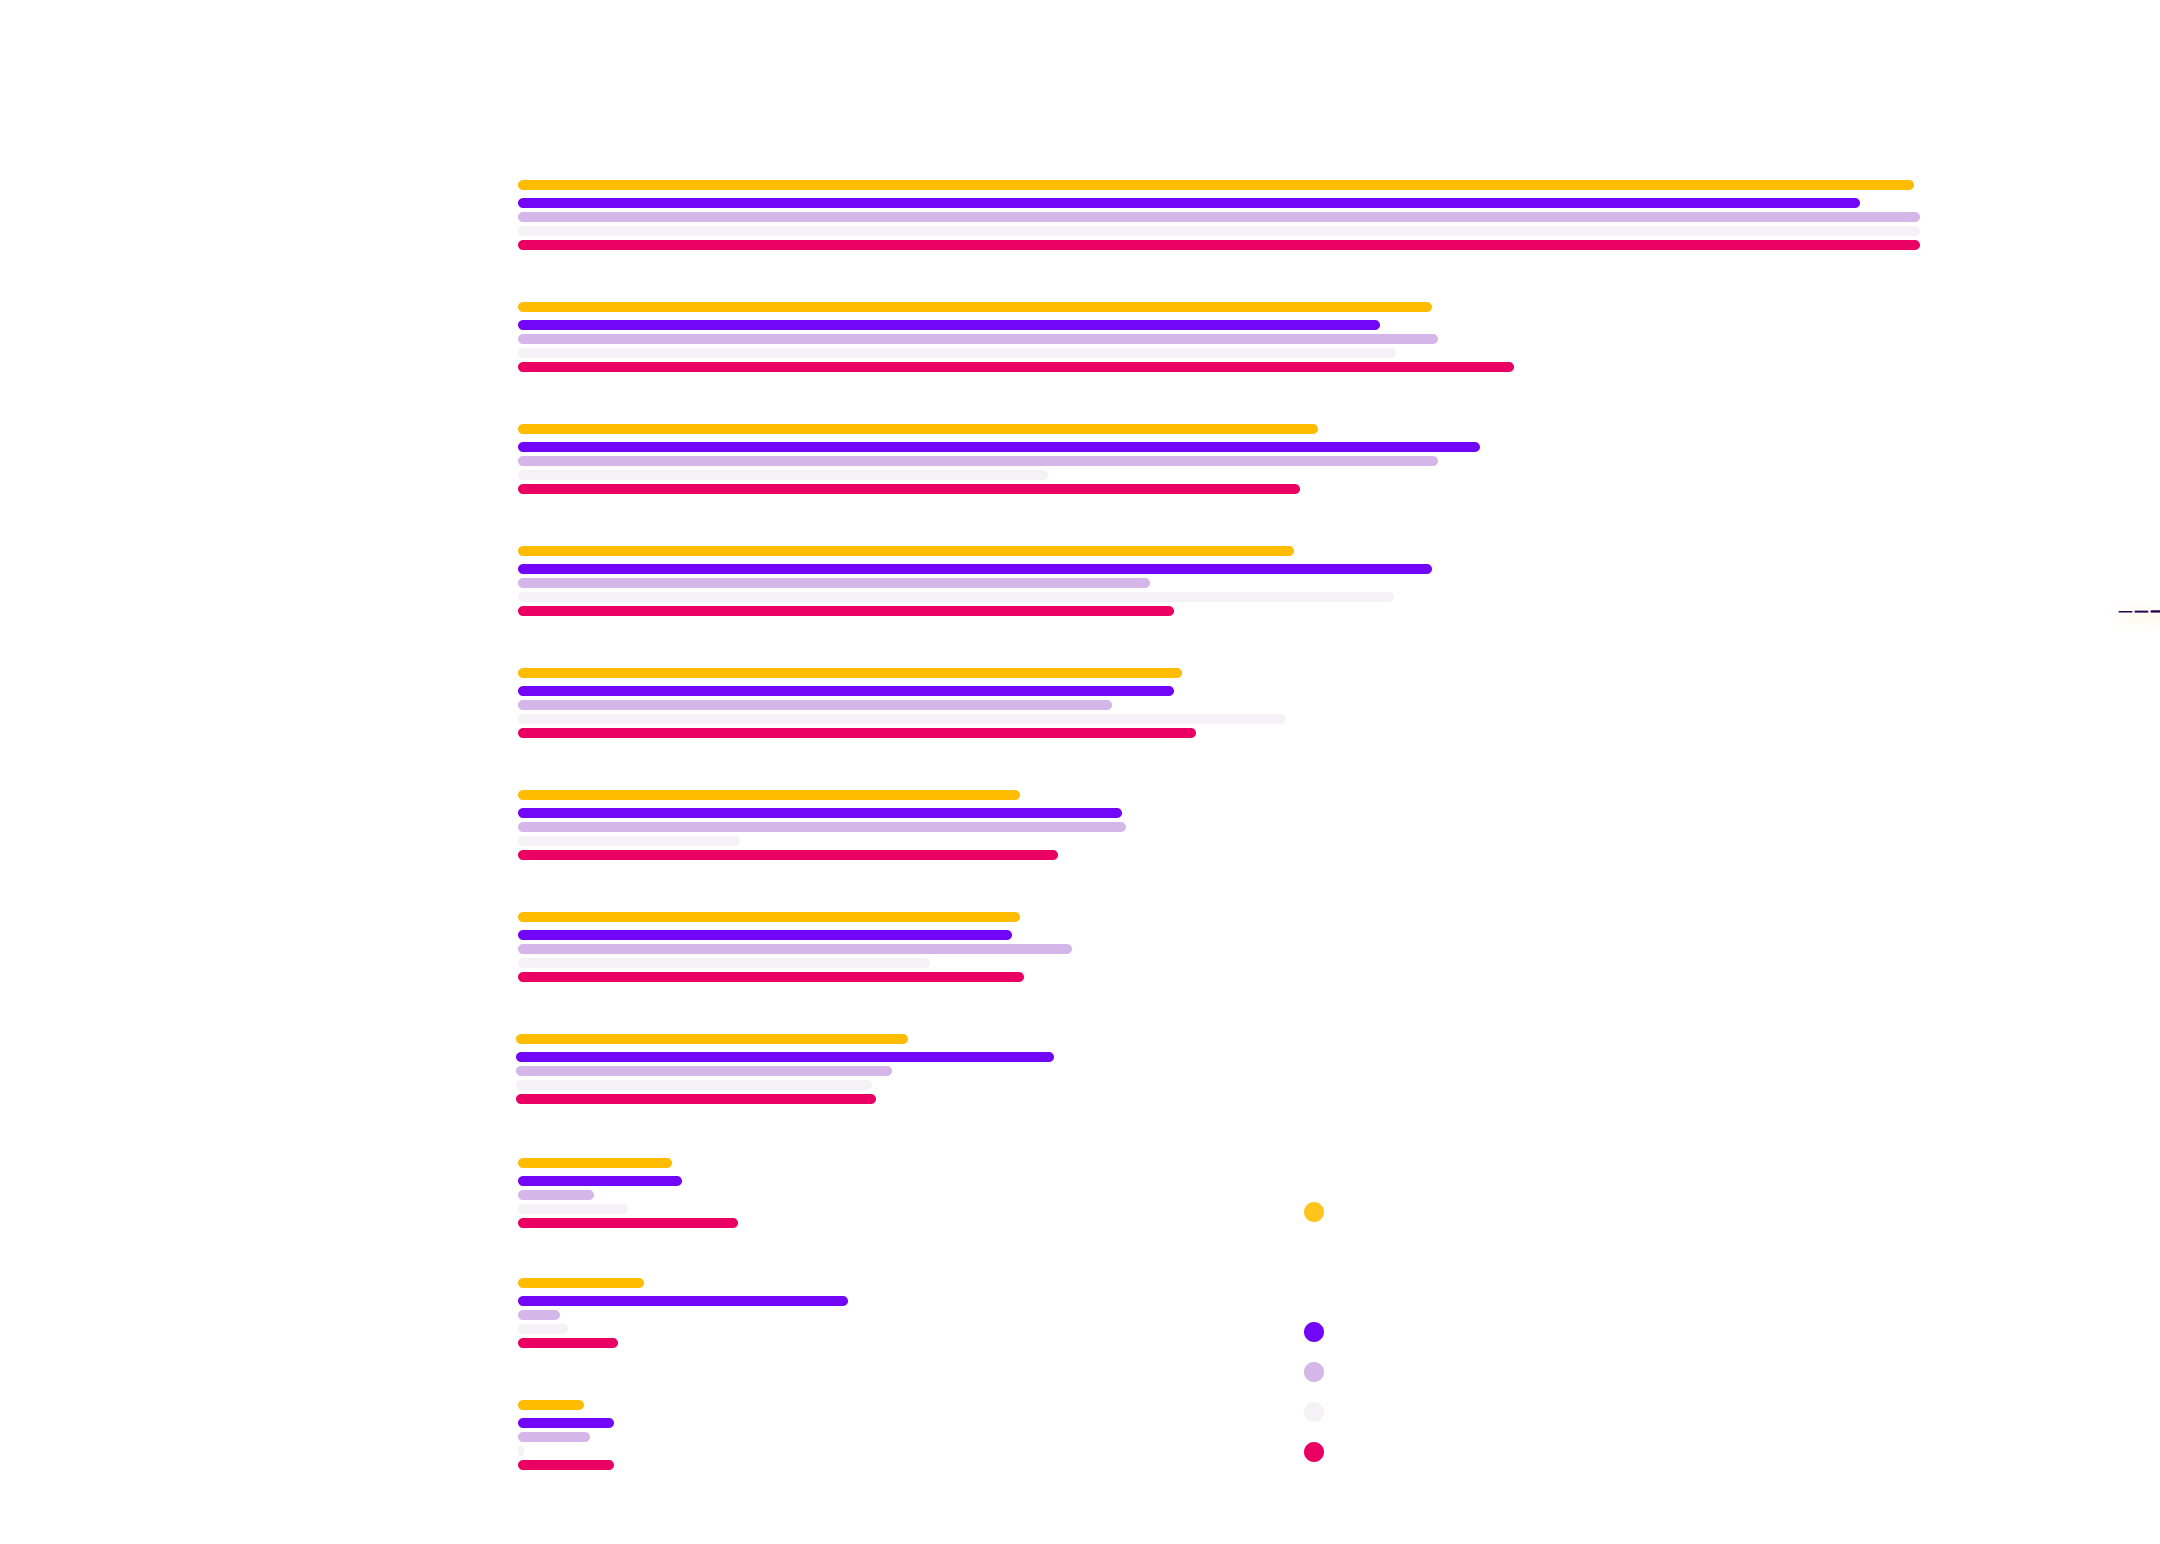
Marketing Channels
High
Growth
Trends
Compared to the overall average, high-growth shows are:
📈 Significantly more likely to utilize pitching podcast apps, and paid advertising.
📈 Moderately more likely to utilize newsletter writing, YouTube, and blogging.
Mid
Growth
Trends
Compared to the overall average, mid-growth shows are:
📈 Moderately more likely to utilize newsletter writing, blogging, and SEO content creation.
📉 Significantly less likely to utilize YouTube, PR, and pitching podcast apps.
Low
Growth
Trends
Compared to the overall average, low-growth shows are:
📈 Moderately more likely to utilize YouTube, and collaborations.
📉 Significantly less likely to utilize newsletter writing, blogging, and pitching podcast apps.
Negative
Growth
Trends
Compared to the overall average, negative-growth shows are:
📈 Moderately more likely to utilize podcast guesting and PR.
📉 Significantly less likely to utilize YouTube.
Primary Social Channels

High
Growth
Trends
Compared to the overall average, high-growth shows are:
📈 Moderately to significantly more likely to utilize Instagram, Facebook, and non-mainstream social channels.
📉 Moderately less likely to utilize LinkedIn and X (Twitter).
Mid
Growth
Trends
Compared to the overall average, mid-growth shows are:
📈 Moderately more likely to utilize Instagram.
📉 Significantly less likely to utilize Facebook, Pinterest, and non-mainstream social channels.
Low
Growth
Trends
Compared to the overall average, low-growth shows are:
📈 Moderately more likely to utilize Twitter, TikTok, and non-mainstream social channels.
📉 Significantly less likely to utilize Instagram and Facebook.
Negative
Growth
Trends
Compared to the overall average, negative-growth shows are:
📈 Moderately more likely to utilize Facbook and TikTok.
📉 Moderately less likely to utilize Instagram.
Key Takeaway
When reviewing the growth rate data, it’s essential to keep in mind the following bit of context:
The shows most likely to experience negative growth on a per-episode-released basis are those with the largest audiences.
As such, their marketing strategy is likely to focus less on growth and more on revenue generation and audience engagement than smaller, up-and-coming shows.
It’s also worth remembering that while the 39 shows in this category experienced a decline in per-episode growth, 56% of them increased their total annual downloads (as result of increasing their publish frequency).
05
Closing Thoughts
To close, we asked respondents a series of questions about their personal experiences and feelings around marketing as a whole.
Here’s a collection of their responses.
Biggest Marketing Challenge
When asked what their biggest challenge was when it came to marketing their shows, 43.5% of respondents cited “understanding which specific strategies are effective” as the number one challenge.
How Podcasters Measure Success
While respondents’ reasons for producing their shows varied widely, the way they tracked success didn’t with 80% of respondents citing podcast downloads as the primary metric they used to measure success.
Despite the majority of shows having some connection to a business, only 10.4% cited an income-related metric as their primary measure of success
Where Podcasters Learn About Marketing
Social media (63.6%) emerged as the resource podcasters were most likely to have used to learn about marketing, followed closely by podcasts (57.6%), newsletters (45.6%), and YouTube (42%).
Podcast Growth Is Slow… But Right On Schedule
While we were surprised at just how low the median podcast growth rates turned out to be, it turns out, the pace of growth is pretty much exactly what our respondents expected when they launched.
When presented with a 1–10 scale of how their growth rate has compared to their expectations, the average rating was 4.9, just a hair below “About the same as I expected”.
How Podcasters Feel About Marketing
When asked to choose from a list of words they associated with the idea of marketing, a majority of respondents chose two words:
“Essential” (53%) and “Time-Consuming” (50.5%).
To our pleasant surprise, dark horse candidates “Exciting” (24.4%), “Fascinating” (23.2%), and “Fun” (22.4%) all had surprisingly strong showings.
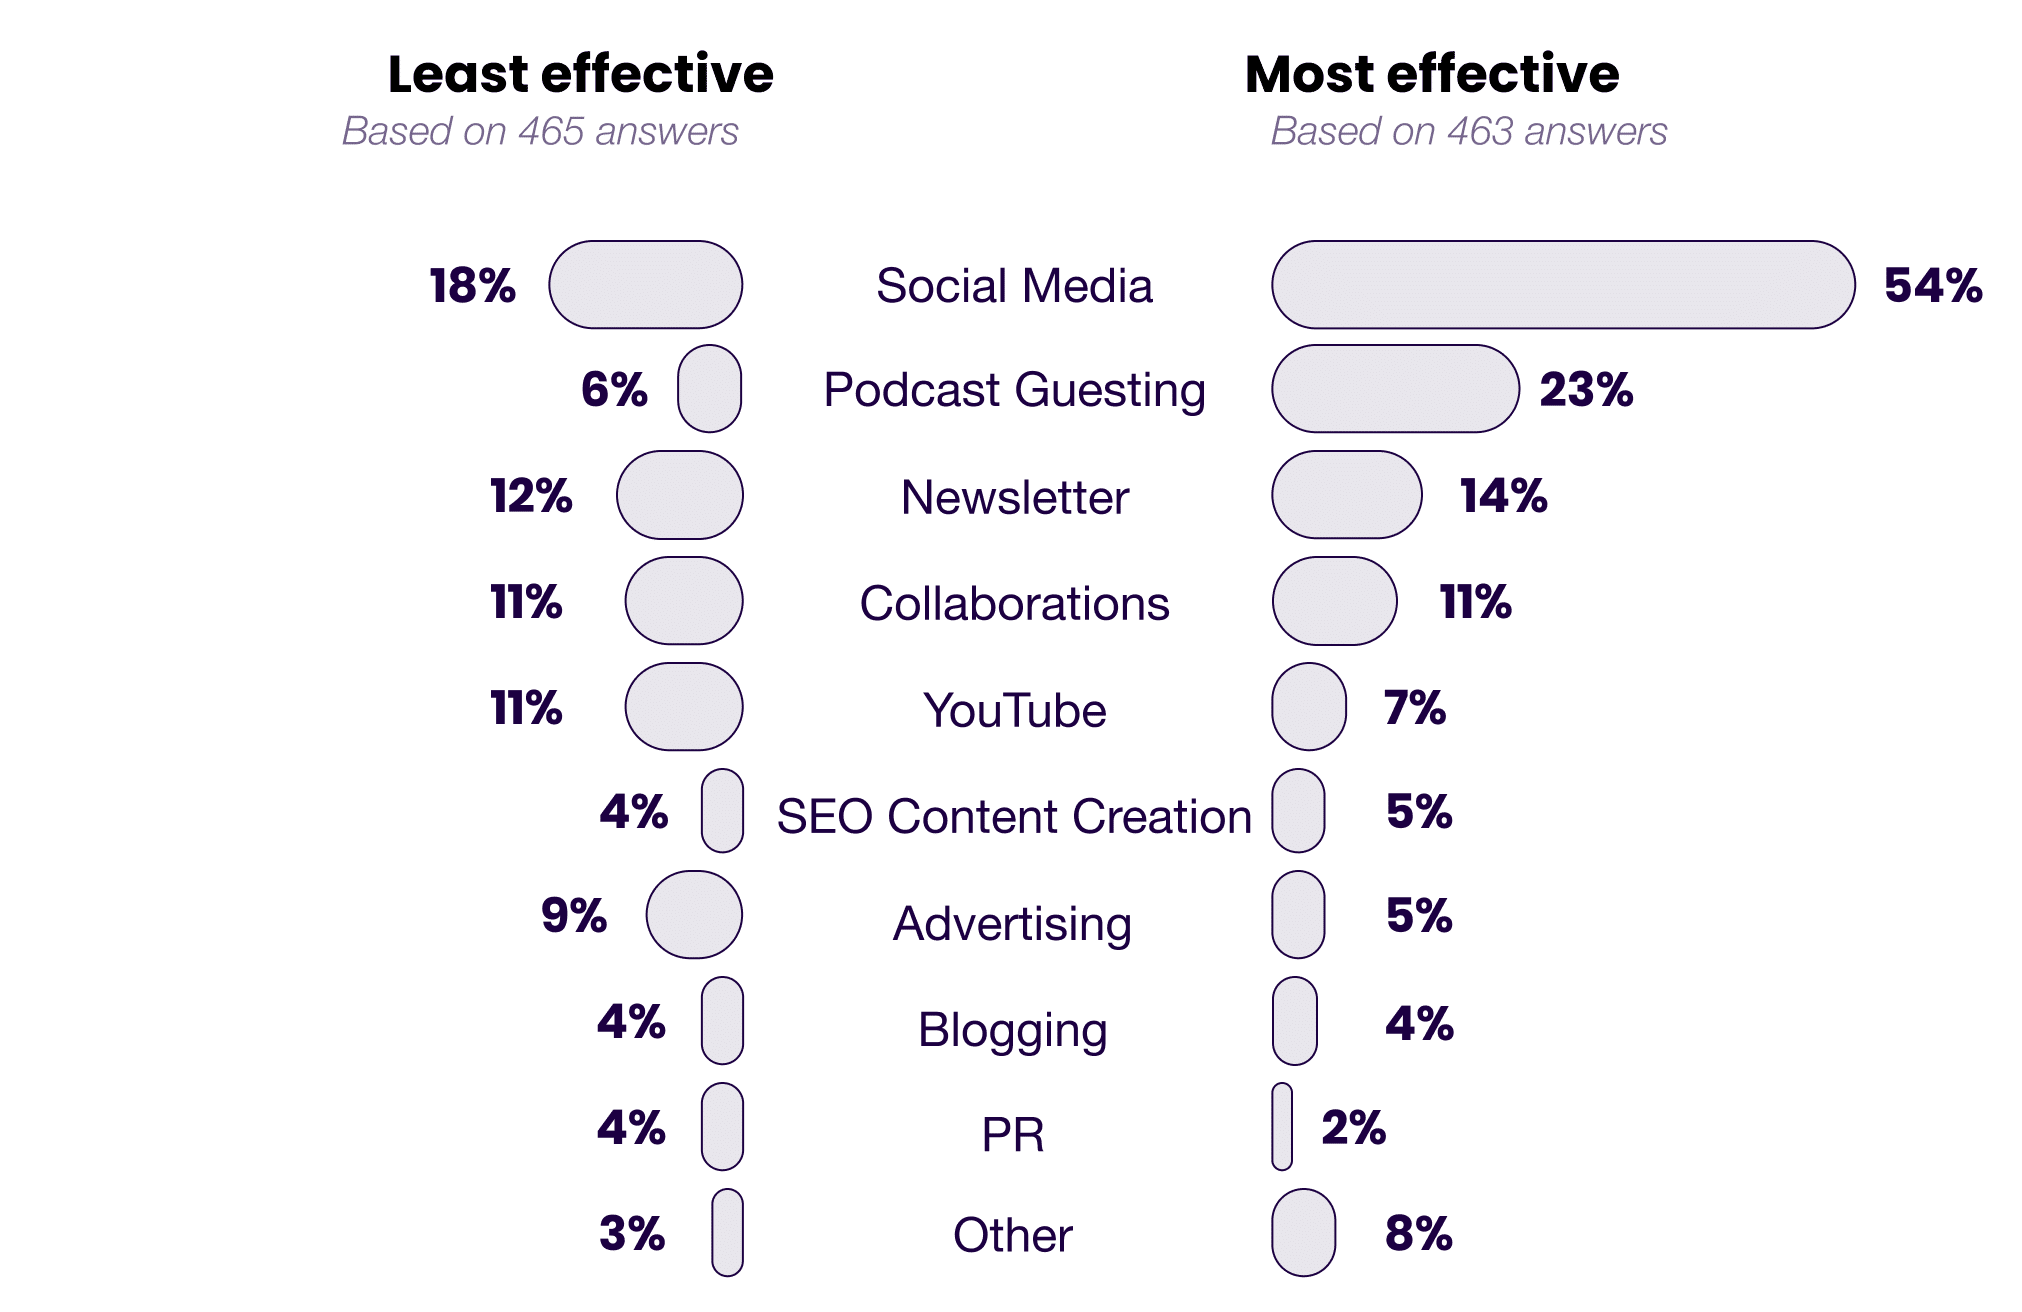
What Works (& What Doesn’t) For Podcast Growth?
Key Takeaway
There are a few things that stand out to us from these results.
The first is that for all the frustration podcasters often have with social media, it’s interesting to see that our respondents overwhelmingly rated it as the most effective channel for podcast growth.
Second is the fact that while many small podcasters imagine that if they only had a budget for advertising, all their discovery problems would be solved, our respondents suggest otherwise.
Only a tiny percentage of podcasters rated paid advertising as the most effective channel for growth, with almost twice as many saying it was the least effective channel for them.
Finally, note that most channels had highly contradictory ratings, with similar percentages of people rating them as both the most and least effective channels.
What’s going on here?
In short, based on our experience, any (and all) of the above channels can be effectively used to grow a podcast.
But to get a given channel to work for you, you need to understand the nuances of how it works, practice and experiment with it consistently to dial it in, and actually enjoy (to an extent) the process of implementing it.
Without these three pieces in place, any channel will fail to deliver meaningful results.
One last thing before we close this thing out.
There will always be trends and commonalities that seem to define the biggest and highest growth shows
But there will also always be outliers.
There’s no one way to grow a show.
No one format, topic, or strategy.
So don’t be afraid to buck the trend and experiment with whacky, scrappy, and unorthodox marketing strategies that no one else is doing.
They won’t always work.
But every now and then, they win big.
As with all marketing, the only way to find out is to test it.
So keep testing and share with us what you’ve learned for next year’s report.
We’ll do the same.
Deal?
Presented By


With Support From


Special thanks to these creators & shows for generously contributing their monthly download data.
